
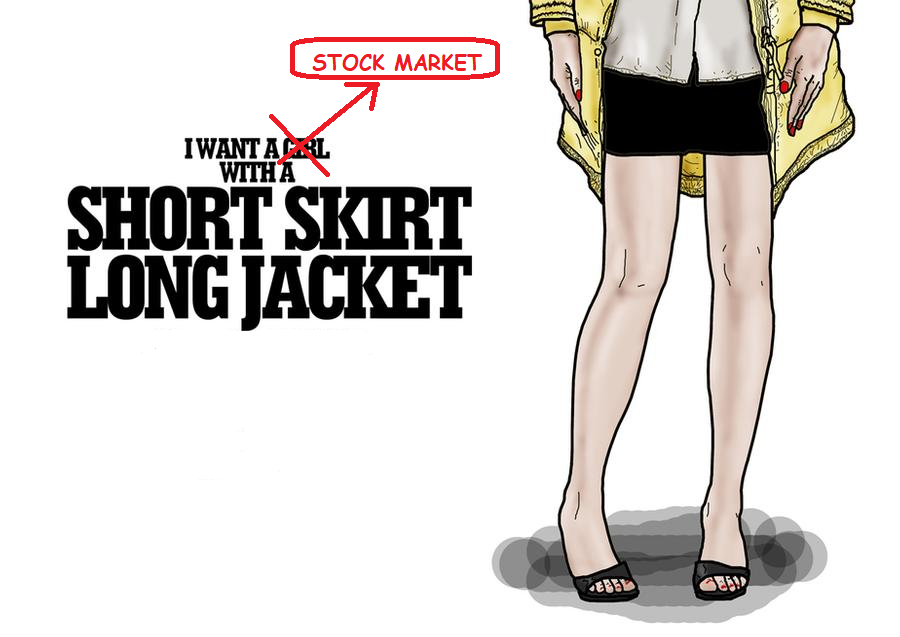
In 2001, the band CAKE released their hit song, “Short Skirt, Long Jacket.” If you replace the word “girl” for “stock market” (in the lyrics below) you’ll see the commonalities with today’s investor.
For starters, today’s investor wants to party in a “short skirt” but continues to guard against the cold (wall of worry) by keeping on their long jacket at all times and not believing in the party (as evidenced by record flows INTO bonds and OUT OF equities) in one of the best years of equity performance in stock market history (2019). Here are the applicable lyrics to today’s market:
I want a girl with the right allocations
Who’s fast, thorough, and sharp as a tack…
I want a girl who gets up early
I want a girl who stays up late
I want a girl with uninterrupted prosperity
Who uses a machete, to cut through red tape…
I want a girl with a smooth liquidation
I want a girl with good dividends…
I want a girl with a short skirt and a long jacket…
Listen to “Short Skirt, Long Jacket” by Cake
Guys and girls alike want this to be a party, but just can’t come around to taking off their long jackets – in case the cold comes in to ruin the party…and that (wall of worry) is exactly what is required to continue higher (over time).
Of similar origin is the outdated (but applicable) Hemline Index, developed by George Taylor in 1926. He posited that hemlines on women’s dresses rise along with stock prices.

Source: Smith Barney
In 2010, Marjolein van Baardwijk and Philip Hans Franses of the Econometric Institute Erasmus School of Economics did an academic study and found:
“We collected monthly data on the hemline, for 1921-2009, and evaluated these against the NBER chronology of the economic cycle. The main finding is that the urban legend holds true but with a time lag of about three years. Hence, the current economic crisis (2008-2009) predicts ankle length shirts around 2011 and 2012.”
You can read the academic study here:
So where does that leave us now?
I haven’t paid much attention to hemlines, but I’m willing to bet they are a bit higher than they were in 2011. Now the question is whether the public becomes comfortable enough to take off their jacket and join the party – or will the “wall of worry” persist and we continue to climb higher?
We need to see what guidance looks like in coming weeks…
With the forward multiple on earnings at ~18.3x – which is above the five year average of 16.6x, but below what would be an “end of cycle” multiple that could get to 19-21x (or more) – we’re going to have to see how CEOs and CFOs guide in coming weeks. The EURO Stoxx 600 2020 guidance has come up 110bps in the last week, so it is well within the realm of possibility we could see (post “phase 1”) guidance improvement in the US as well.
If S&P 500 9.6% EPS growth rate for 2020 holds – with the discount rate having lowered by 75bps in the last few months – we can hold at these levels (or go higher). If there is any indication that C-Suites will begin to take guidance up, the sky is the limit because then you have the earnings power PLUS a turn or two of multiple expansion in the cards.
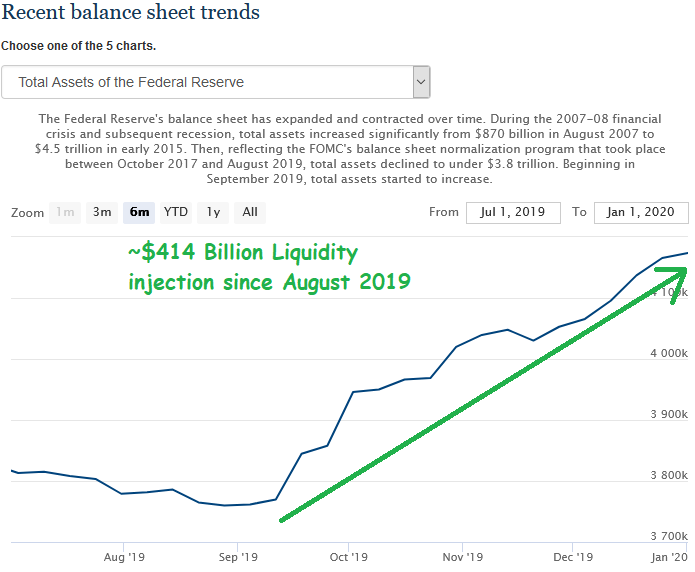
The Fed has stayed Accomodative:
The liquidity injection as of January 1, 2020 is ~$414B since late August 2019:
The Value Line Geometric Growth Index:
This index (introduced in 1961), is an equally weighted index using a geometric average. The daily price change of the Value Line Geometric Composite Index is found by multiplying the ratio of each stock’s closing price to its previous closing price and raising that result to the reciprocal of the total number of stocks.
This week, Chris Ciovacco (Twitter @CiovaccoCapital) included the Value Line Geometric Growth Index in his posts. I found it helpful, so I thought I would add it in this week’s note with my own annotations – going back further in history to find more instances of breakouts (4 total) – and see what happened next:
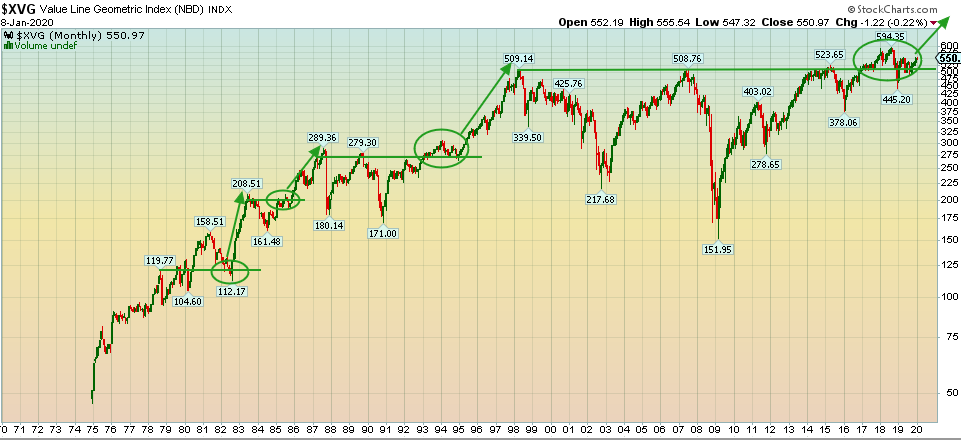
The concept above is a simple “breakout and backtest” pattern that has occurred four times since its inception. As we can see, in all four instances (after the initial breakout), there was a backtest back to the green breakout line. After that line held (and the test was passed), major gains in the indices followed (see four green circles). While it is only four instances, you can see that the longer the base was in time (green horizontal line), the bigger the move the indices made (in percentage terms) before hitting a new peak.
The first instance was a longer base (4 years) than the second instance (2 years), and the move was larger as well ~85% versus ~38%. The third instance was an 8 year base, and the move was ~92%. Our current base is ~21 years. How much appreciation would be realistic?
We’ll just have to see how the data comes in, but with 85M millenials beginning housing formation – relative to 80M boomers who started the same process at the 1982 breakout – it may just be time to drop the long jacket and join the party…
Now onto the shorter term view:
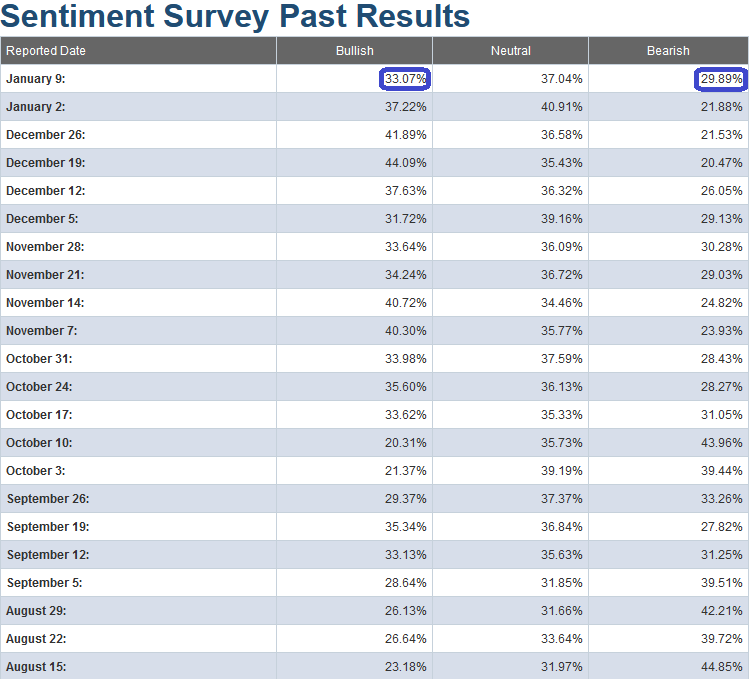
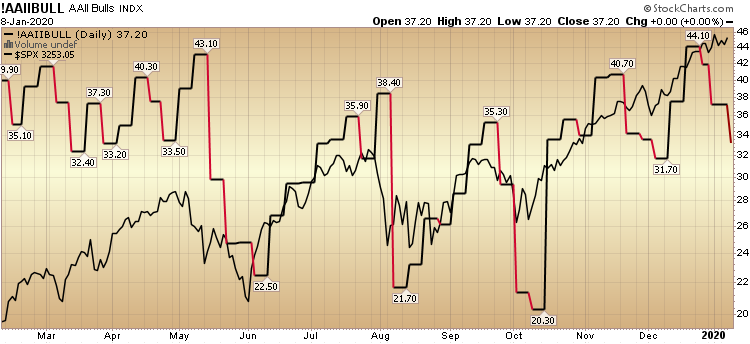
This week’s AAII Sentiment Survey result (Video Explanation) Bullish Percent came in at 33.07%, down from 37.22% last week. Bearish Percent jumped to 29.89% from 21.88% last week. For bearishness to rise by over a third in the face of the market making new highs, it tells you that there is still not wholesale “buy-in.” Folks are still clinging to their long jackets…
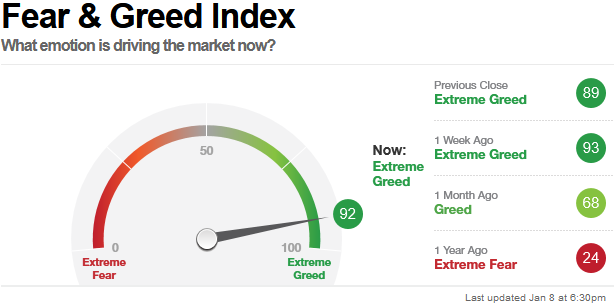
The CNN “Fear and Greed” Index – which fell 1 point (from 93 last week to 92 this week) modestly confirmed the drop in the AAII Sentiment Survey. It is at an extreme level. This is generally not the place you want to be adding a lot of NEW exposure unless it is in stocks/sectors that have not yet participated in the rally and have solid fundamentals. You can learn how this indicator is calculated and how it works here: (Video Explanation)
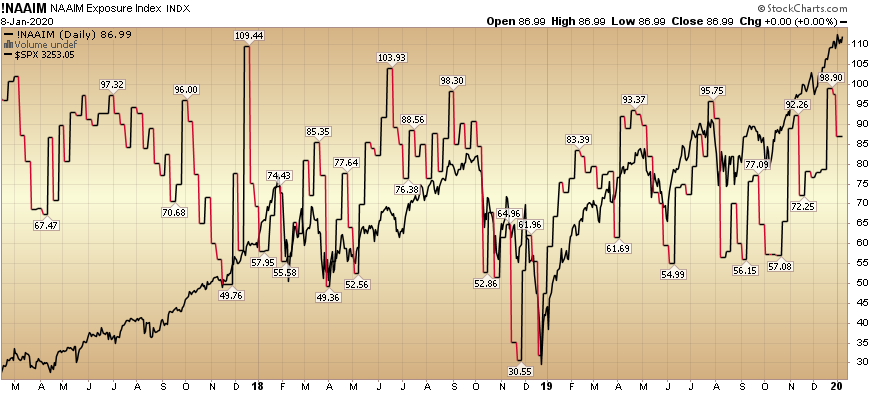
And finally, this week the NAAIM (National Association of Active Investment Managers Index) (Video Explanation Here) dropped from 97.44% equity exposure last week, to 86.99% this week. While this is still an elevated level, these levels can stay “pinned” for some time (similar to the 2016-2017) when they are emerging from a significant trough (like early 2016 and late 2018). For a more detailed explanation of “pinning” use the search bar on the right side of the site to find the “Katy Perry” article.
Our message for this week is similar to last couple of weeks:
We remain bullish in the intermediate term (for 2020). As we have stated in our last notes, we have trimmed some names that have had huge runs off of the August/September lows, and had re-allocated some profits into sectors/stocks that had just begun to participate.
You can review our previous notes under the category “Sentiment” on the right side of the site.


