

(Image Source: Corbis)
In 1944, Russ Morgan, Larry Stock, and James Cavanaugh published the song “You’re Nobody till Somebody Loves You.” It became a hit for Morgan in 1946 – reaching No. 14 on the charts.
It became legendary 18 years later when Dean Martin recorded it (in 1964) – spending 9 weeks on the Billboard 100. 32 years after that, it was the opening track for the 1996 classic film Swingers starring Vince Vaughn, Jon Favreau and Heather Graham. One of the best movies of all time…
We chose this song because the lyrics speak to our top two positions for 2022 [Biotech and China Tech (Alibaba)]:
You’re nobody ’til somebody loves you
You’re nobody ’til somebody cares…
China Tech (Alibaba) and Biotech have been the two least loved sectors in recent weeks, but we believe this is changing. As we always remind our listeners|viewers on our weekly podcast|videocast, “Opinion Follows Trend.” Before long, Dino’s velvety lyrics will come to pass for both Biotech and China Tech (Alibaba) and everyone will love them once again.
The world still is the same, you never change it
As sure as the stars shine above…
Fox Business
The last two weeks I went on Fox Business – The Claman Countdown – with Liz Claman, talking about our new position in Biotech. Thanks to Liz and Ellie Terrett for having me. In this most recent clip from Friday, we go into some detail on the thesis behind our purchases:
Watch in HD directly on Fox Business
Here were my notes for the show:
Good News: Jobs report came in MUCH better than expected.
Bad News: Hourly earnings hotter than expected giving Fed green light to move ahead full steam.
# of unemployed: 6.5M versus 5.7M Feb 2020. UE Rate: 4.0% versus 3.5% pre-pandemic.
I know Liz is hockey fan like me so we want to skate where the puck is GOING. We were on the show in 2020 buying Banks and Energy stocks when no one wanted them. Now that they are all up double and triple, EVERYONE wants them and it may be getting a little crowded in the near term.
While Exploration & Production names MAY push a bit higher as oil prices are elevated, one should beware that any type of Iran deal could add supply onto the market overnight. Saudi Aramco just announced they are selling another $50B in stock for a reason. The Administration is incentivized to get something done w/Iran in a mid-term election year as CONSUMER CONFIDENCE is joined at the hip with INFLATION. As prices have gone up, confidence numbers have come down. If you must put new money to work in energy, the servicers have lagged (OIH) and could play catch up as the rig count ticks up in coming months.
Where is the Puck Going? In the past week and a half we started focusing on Biotech. Just as people are going back to work, they are also going back to the Doctor for checkups, treatments and procedures unrelated to COVID.
We looked at the earnings power of the top 30 holdings in the XBI (Equal Weight Biotech) ETF. Since November, the cumulative 2022 estimates have come down –0.41%, while the sector (EFT) dropped over 37%. We think this dislocation is temporary as Valuations have fallen so much that there are about 100 biotech companies whose cash stockpiles exceed their stock-market values. Play basket XBI.
Biotech
In the last two weeks, the group is now up ~15%+ off its lows:
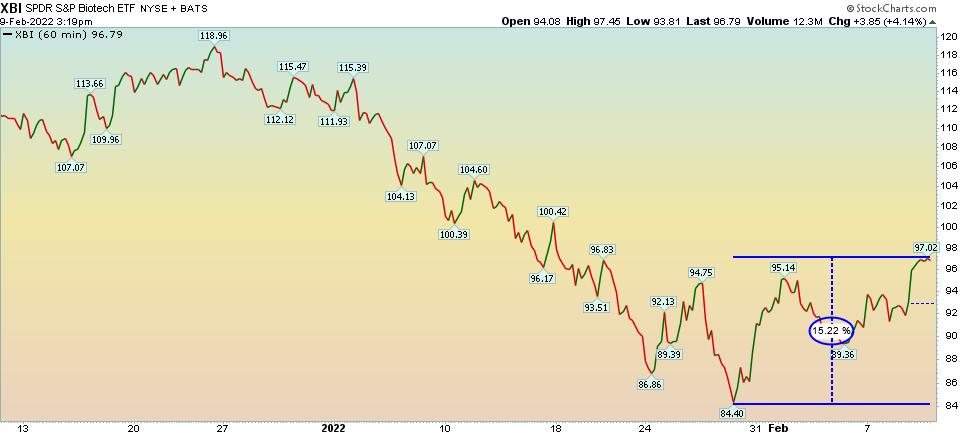
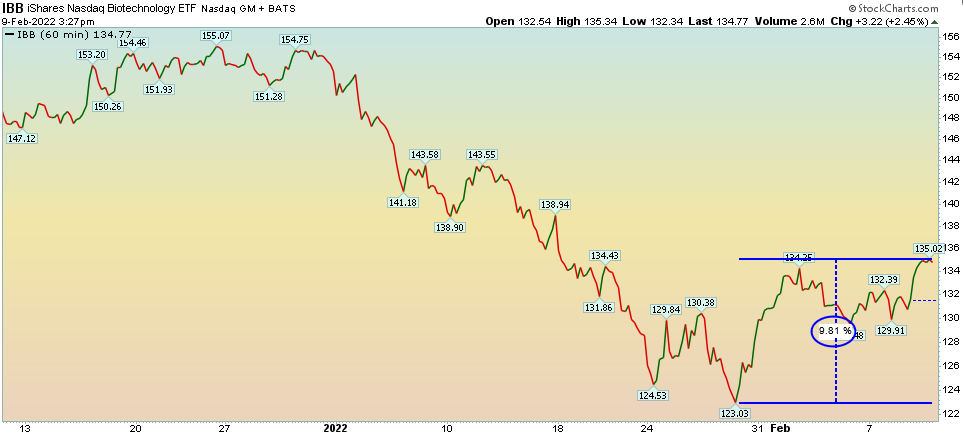
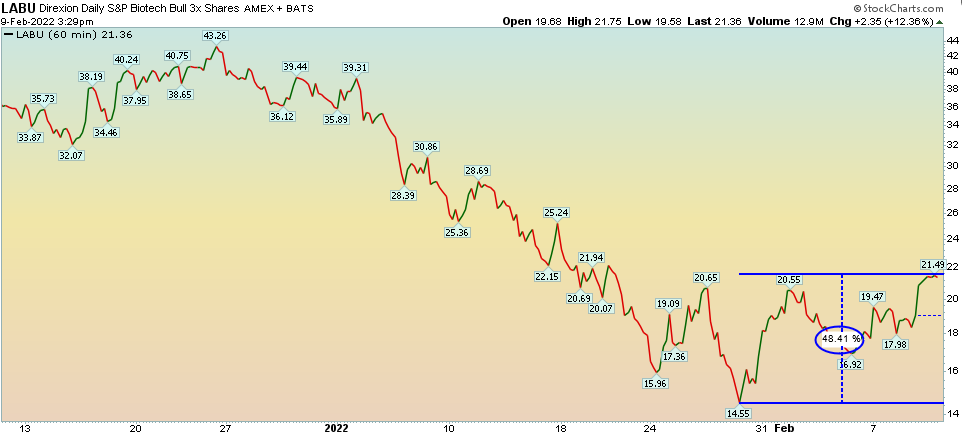
(3 Charts Source: StockCharts.com w/annotations by Tom Hayes)
See our previous 2 notes on Biotech here:
Bank of America put out the following table this week regarding Biotech:

Source: MarketWatch
This quantitative study of where Biotech stocks are trading as a group (relative to their historic average multiple) implies the sector should appreciate:
24% – to get back to average Price to Book multiple
155% – to get back to average Price to Operating Cash Flow multiple.
112% – to get back to average Forward P/E multiple.
For my money, Cash Flow is the most important metric as that is the means a company has to return capital back to shareholders in the form of buybacks, dividends or accretive acquisitions.
It’s also important to note that just as multiples overshoot to the extreme on the downside, they also tend to overshoot in the euphoria on the upside – once they recover. In other words, they don’t return to their average multiple and STOP! They will overshoot beyond that before settling out.
With Omicron winding down, just as people are gong back to the office, they are also starting to go back to the Doctor for checkups, screenings and treatments. This – along with drug sales reps getting off Zoom and on the road – will lead to a significant uptick in scripts/demand.
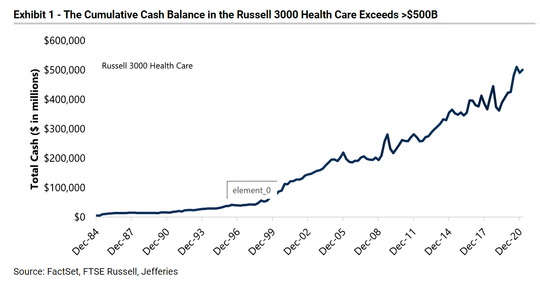
The final catalyst will be M&A. Per the table below, the cash balance of Russell 3000 Health Care companies exceeds $500B. This is up ~400% in the past 20 years. With Big Pharma losing their patents on many blockbuster drugs, but having tons of cash on their balance sheets, they will be forced to aggressively BUY innovation in the Biotech sector to maintain/accelerate growth.
Source: MarketWatch
M&A fell near historic low lovels in 2021. That will change soon:
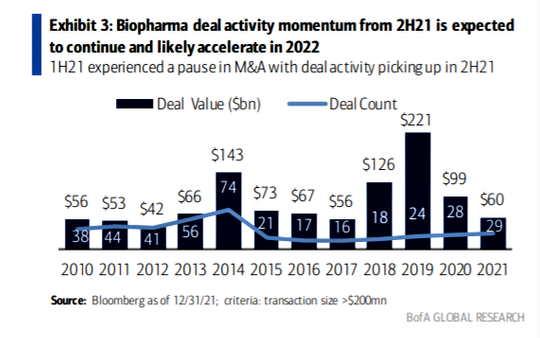
Source: MarketWatch
Alibaba Update
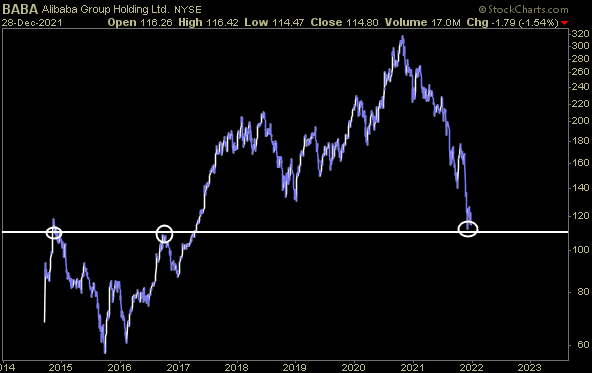
If you didn’t buy Alibaba in December – when it was trading at 2014 prices – this past week was probably your last chance to buy at historically low prices:
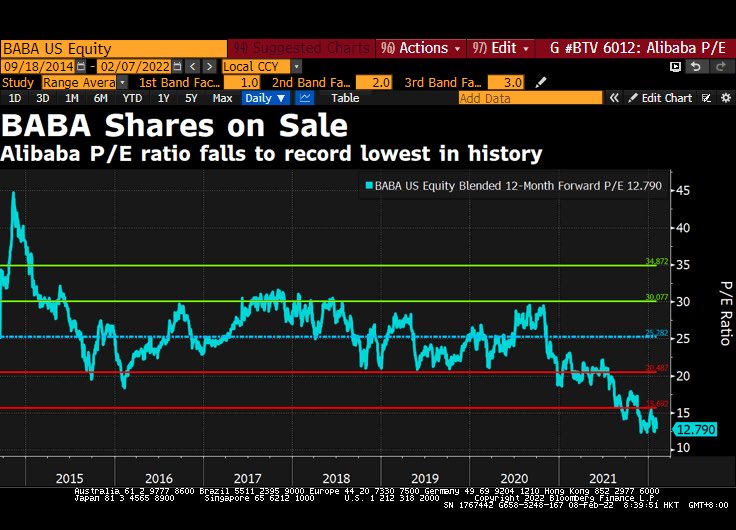
Source: David Ingles – Bloomberg
(Chart Source: StockCharts.com w/annotations by Tom Hayes)
The stock sold down meaningfully in the past week on fears that Softbank was blowing up and would have to sell off its largest position (Alibaba) – which represents ~25% of its holdings. Instead, Masayoshi Son came out and said:
- He would simply IPO ARM holdings next year to raise cash (after the sale fell through with Nvidia). Softbank is getting a $2B breakup fee from Nvidia.
- Via Bloomberg: “Alibaba Group Holding Ltd. shares jumped in Hong Kong as SoftBank Group Corp. said it wasn’t involved in the Chinese tech giant’s filing of additional American depositary shares, allaying investor fears that the firm’s largest shareholder might be looking to cash out. Shares in Alibaba had fallen earlier this week after the firm filed to register an additional one billion ADSs with the Securities and Exchange Commission. That triggered analyst speculation that SoftBank might look to dispose of some of its shares, particularly as it is seen to need cash to fund buybacks. SoftBank executives told analysts during a private post-results briefing Tuesday that they weren’t responsible for the share registration.”
As I stated in my December 30 note, this was a once in a lifetime opportunity to buy at 2014 prices:
(Chart Source: StockCharts.com w/annotations by Tom Hayes)
From 2014-2021 (7 years), Alibaba grew –
Revenues (per share) by 894.93%
Cash Flow (per share) by 559.46%
Earnings (per share) by 601.92%
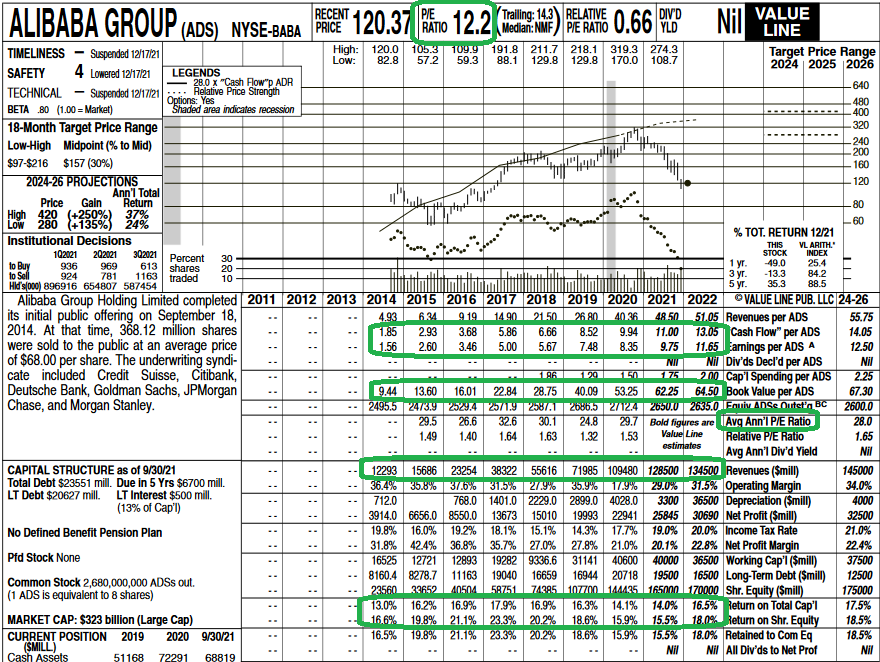
Source: Valueline
Over the same 7 years, WHILE THE BUSINESS GREW MANY MULTIPLES (~500-900% depending which metric you emphasize), the stock price GAINED ZERO PERCENT. ZERO, ZILCH, NADA…
We are buying a business that has grown 5-9x (depending on metric) for the 2014 price it traded at before the growth. Even if top and bottom line growth rates HALF from here (which they won’t), it is still a rare opportunity – in our view.
Ben Graham, “in the short run the market is a voting machine, but in the long run it is a weighing machine.”
Just remember, ALL SALES HAVE EXPIRATION DATES…
Jobs Report and Implications
On Friday night I joined Sean Callebs – on CGTN America’s Global Business show – to discuss the Jobs report and implications. Thanks to Ryan Gallagher and Sean for having me on:
Show Notes:
*Overall take on the number of jobs created in January…
Overall, very good. The Establishment Survey is a survey of private nonfarm businesses blew the doors off (+467k vs. +150k expected).
Household survey is conducted by the Census Bureau and showed # of unemployed workers actually rose by 135k.
Print Est. Last
Unemployment Rate (Jan) 4.0% 3.9% 3.9%
Participation Rate (Jan) 62.2% 61.9% (63.4% pre-pand)
# of unemployed persons: 6.5M versus 5.7M Feb 2020.
Unemployment rate 4.0% versus 3.5% pre-pandemic.
Long Term Unemployed (27+ wk) 1.7M versus 1.13M pre-pandemic
*Why or where were the jobs created, especially since the US was in the throes of the Omicron wave?
15.4% of the workforce “teleworked.” Society is adapting to the stop and start nature of the variants we have overcome.
Jobs were created because –
1) employers paid up to get labor:
Average Hourly Earnings (YoY) +5.7% 5.2% 5.0%
2) Benefits ran out.
3) Vaccine mandates overturned. 26% population not vaccinated. Increased supply of labor now.
*Should we expect a correction at some point (possibly in February) when employment gains dip?
You will likely see some revisions to the headline number, but the economy is generally strong (~4% GDP est. for 2022) and the trend is UP as people go back to work (and Omicron winds down).
Earnings for the S&P 500 are expected to grow 8.6% over last year.
*Leisure and hospitality saw the biggest gains – Are Americans getting back to traveling? And if so, what does that mean for the overall economy?
Leisure and Hospitality expanded by 151,000. food services and drinking places (+108,000). Still down 10.3% since pandemic.
This is a big development. TSA passthrough numbers have been averaging ~75% of pre-pandemic numbers (even during Omicron).
We are starting to see a shift from demand for GOODS to demand for SERVICES as omicron wanes. This will alleviate some pressure on the supply chain and start to bring down headline inflation.
Professional and Business services added 86,000 (511,000+ pre-pandemic)
Retail trade employment rose by 61,000
*Trucking jobs increased by 7500 – What does that say about supply chain disruptions? …and might that give us a clue about inflationary concerns in the coming months?
Transportation and warehousing increased by 54,000 (all component industries -including trucking – have now surpassed their February 2020 employment levels).
Warehousing and storage is biggest gainer (+410,000 more than pre-pandemic)
Money Mitch!
On Monday – after the close – I joined Mitch Hoch on Benzinga for a longer interview. We discussed the general Stock Market/Sentiment, Fed/Rate Hikes, Energy, Russia, Iran, Re-opening, Boeing, Disney and more! Thanks to Mitch for having me on. You’ll find (as usual) a non-consensus view regarding the headlines that most are currently worried about:
Show Notes:
Market General:
Buy the dips until the yield curve inverts.
You historically DO NOT get 20% bear market corrections in the S&P 500 without a Recession.
Recessions are preceded by an inversion of the Yield Curve (2/10 spread). While the curve has been flattening since June of last year, we are nowhere near inverting.
A recession is defined as 2 quarters of negative GDP growth. The US is expected to grow GDP ~4% in 2022.
Sentiment washed out 2 Mondays Ago: AAII Bullish Percent hit 21% last week (lowest since 2020). AAII Bearish Percent hit 46.7% (highest since 2020). These levels usually occur near short-term bottoms.
VIX hit 38 (peak fear), collapsed to 22.7 today.
CBOE Total Put/Call Ratio hit 1.26 that Monday – another extreme – meaning people were buying puts for protection at the exact wrong time. The time to buy insurance is BEFORE the fire, not after the house is leveled! This level is usually associated with reversals.
EARNINGS ARE THE NAME OF THE GAME.
After flat-lining for weeks 2022 EPS Est. popped up to $224.85 for the S&P 500 last week. 8.6% earnings growth.
DISNEY
Walt Disney (DIS) EPS – 0.58 (whisper .61) REV – 20.27B
Netflix was slammed by ~25%, because it came out with a disappointing quarter and a disappointing outlook for subscribers.
The one number to watch is Disney Plus net additions of subscribers. The Street is looking for 7 million. Disney came out in the preceding quarter with 2 million net additions to Disney Plus. Disney shares are ~down 17% since.
Evercore ISI: noting an increase in downloads in recent months for Disney Plus.
With Disney targeting between 230 million and 260 million subscribers by the end of its 2024 fiscal year..
We are bullish on park attendance and taking the long-view on this company.
ENERGY:
We want to skate where the puck is GOING. We were out publicly in 2020 buying Banks and Energy stocks when no one wanted them. Now that they are all up double and triple, EVERYONE wants them and it may be getting a little crowded in the near term.
Iran Deal talks set to resume in Vienna tomorrow. Could add 1.4 – 1.8M bbl/day back on the market.
While Exploration & Production names MAY push a bit higher as oil prices are elevated, one should beware that any type of Iran deal could add supply onto the market overnight. Saudi Aramco just announced they are selling another $50B in stock for a reason. The Administration is incentivized to get something done w/Iran in a mid-term election year as CONSUMER CONFIDENCE is joined at the hip with INFLATION. As prices have gone up, confidence numbers have come down. If you must put new money to work in energy, the servicers have lagged (OIH) and could play catch up as the rig count ticks up in coming months.
Re-Opening Plays
Best way to play is Boeing. Will get recertification completed in China completed imminently and the orders will follow. Still down ~50% from pre-pandemic and operates in a duopoly.
Cruises:
RCL – Best in class
CCL – Most Upside.
Now onto the shorter term view for the General Market:
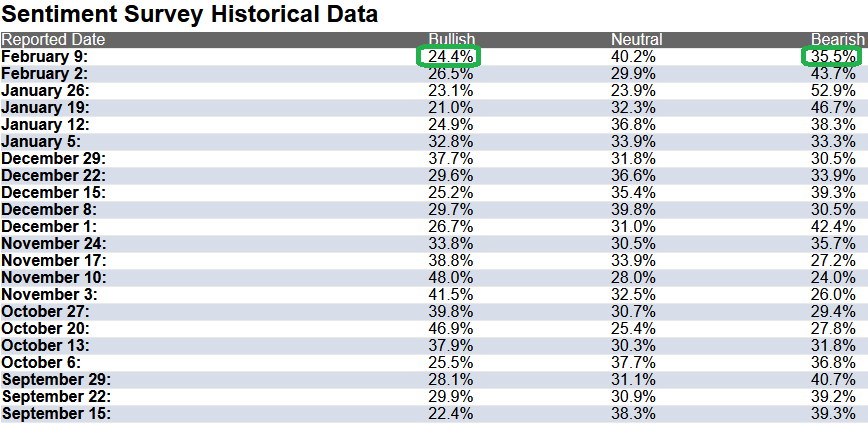
In this week’s AAII Sentiment Survey result, Bullish Percent (Video Explanation) ticked down to 24.4% this week from 26.5% last week. Bearish Percent dropped to 35.5% from 43.7%. Retail trader/investor sentiment is still fearful.
(Source: AAII)
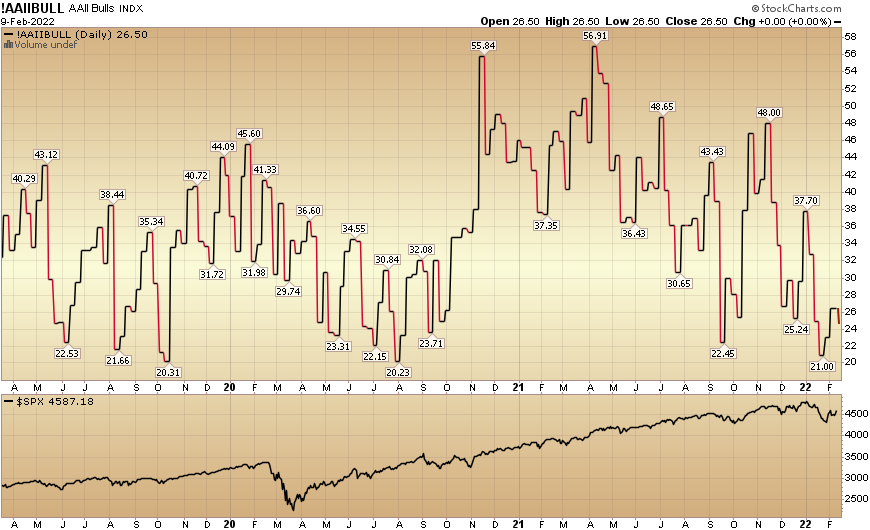
(Chart Source: StockCharts.com w/annotations by Tom Hayes)
The CNN “Fear and Greed” Index ticked up from 36 last week to 40 this week. There is still fear in the market. You can learn how this indicator is calculated and how it works here: (Video Explanation)
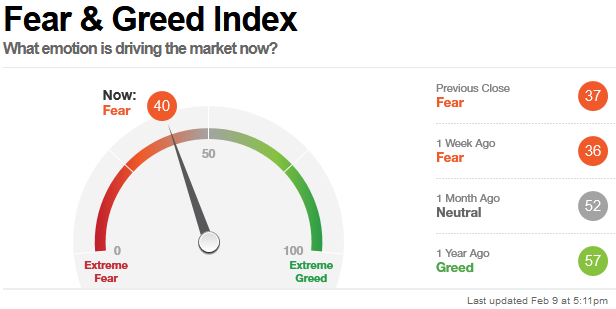
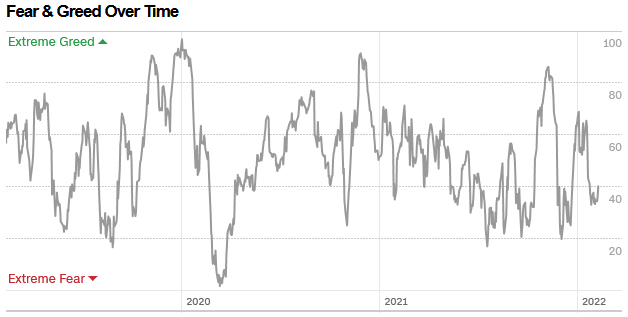
(Source: CNN)
And finally, this week the NAAIM (National Association of Active Investment Managers Index) (Video Explanation) rose to 62.54% this week from 53.39% equity exposure last week. Managers will have to chase any strength in coming weeks.
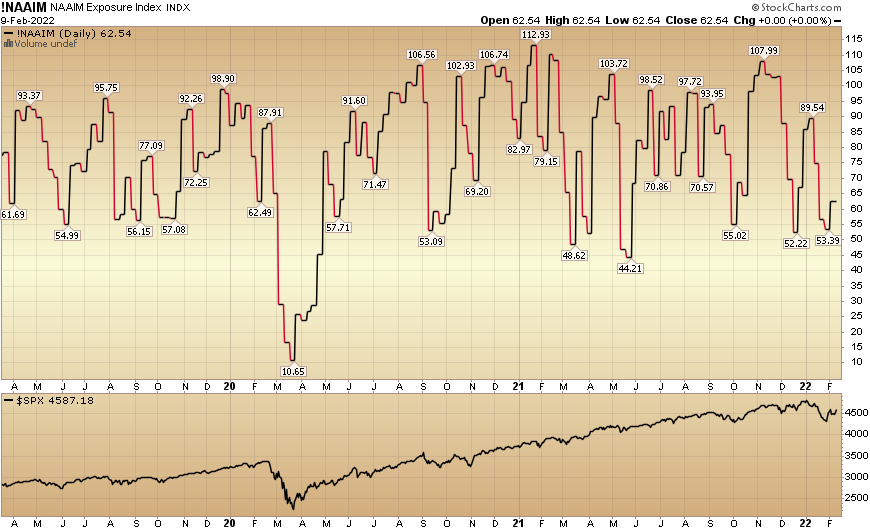
(Chart Source: StockCharts.com w/annotations by Tom Hayes)
Our podcast podcast|videocast will be out either tonight or tomorrow night. We have a segment each week called “Ask Me Anything (AMA)” where we answer questions sent in by our audience. If you have a question for this week’s episode, please send it in at the contact form above.
(Source: Pinterest)


