

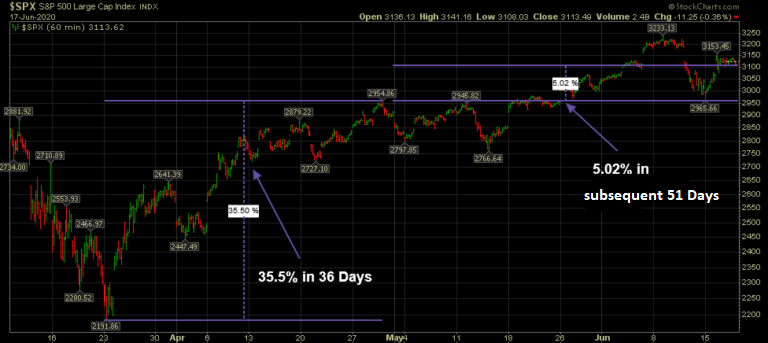
This week’s stock market theme song is Drake’s “Toosie Slide.” We chose this song to capture sentiment as the market has been consolidating its gains in “Drake style” for the past 51 days:
Left foot up, right foot slide
Basically, I’m saying either way, we ’bout to slide, ayy
Can’t let this one slide, ayy
This is normal, natural behavior that the market must experience before moving to new highs over time.
Yesterday I was on Yahoo! Finance with Melody Hamm to discuss the Stock Market, Sentiment and Positioning. Thanks Melody and Sarah Smith for having me on. We covered some important statistics about Managers’ current sentiment and outlook – versus how they are positioned – and what that may portend for the market moving forward. You can view it here:
The second subject we covered is institutional money manager sentiment and positioning. Even after a ~45% rally off the lows, managers are relatively pessimistic and skeptical. However, they have been forced back into the market. Here are some highlights:
OUTLOOK:
- 53% say the comeback from the March lows is a “bear market rally.”
- Only 37% believe it’s a new bull market.
- Only 18% of investors expect a V-shaped economic recovery.
- A net 46% of participants in the survey expected a prolonged recession versus 93% in April. (pessimism thawing).
- 78% believe the market is overpriced.
POSITIONING:
- Investors took cash levels down from 5.7% to 4.7% since last month, the biggest “dash from cash” since August 2009.
- FORCED IN: Net equity exposure, despite the valuation concerns, rose 18 percentage points (from 34% in May to 52% in June).
- Managers started buying less popular groups – such as small-caps, value, euro-zone and emerging-market stocks.
- Investors decreased their net exposure to technology, pharma and communication stocks. They began to moderate their underweights in materials and energy.
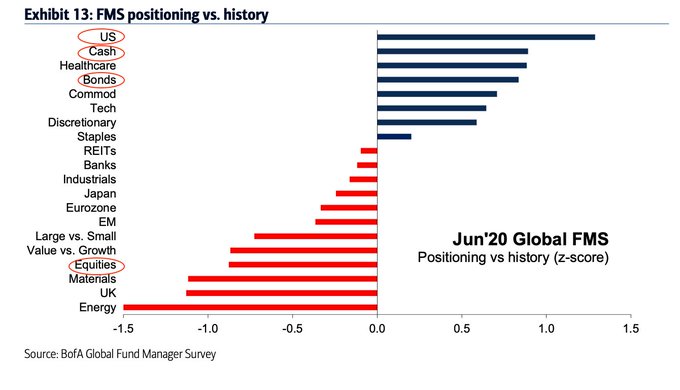
For a comprehensive summary of the Bank of America Global Fund Managers Survey (posted on Tuesday) click here:
June Bank of America Global Fund Manager Survey Results (Summary)
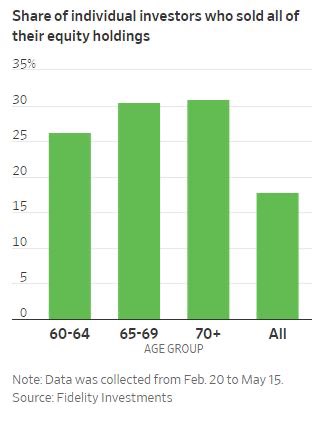
The core takeaway is that managers are still holding cash and playing relatively defensive. There is a modest shift out of tech and defensives into cyclicals, but no signs of euphoria yet. This level of skepticism implies that the “pain trade” is still up. This view was additionally compounded by the percentage of individuals who sold out of all of their equity holdings at the bottom. They have cash and will be forced back in (sooner or later):
CBOE SKEW:
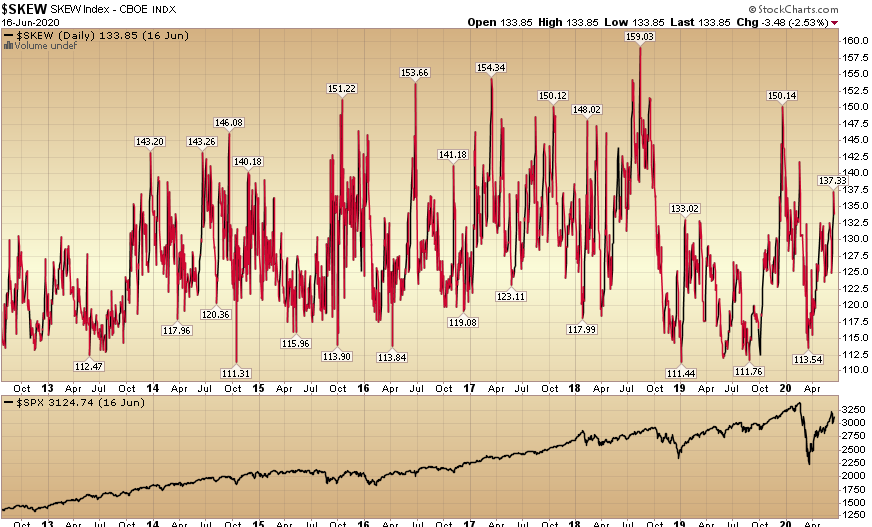
Although a reading above 150 doesn’t always presage a correction/crash, a material correction/crash is usually preceded by a skew spike above 150. We have not hit those levels at present. In simple terms, the implication is that a high reading increases the price/demand to insure tail risk.
Explanation of Skew (source: investopedia):
The SKEW index is calculated using S&P 500 options that measure tail risk — returns two or more standard deviations from the mean — in S&P 500 returns over the next 30 days. The primary difference between the VIX and the SKEW is that the VIX is based upon implied volatility round the at-the-money (ATM) strike price while the SKEW considers implied volatility of out-of-the-money (OTM) strikes.
SKEW values generally range from 100 to 150 where the higher the rating, the higher the perceived tail risk and chance of a black swan event. A SKEW rating of 100 means the perceived distribution of S&P 500 returns is normal and, therefore, the probability of an outlier return is small.
Specifically, the index measures the slope of implied volatility, which can then be expressed as the probability of a two or even three standard deviation move by the S&P 500 over the next thirty days. Skew can thus be used to help determine risk.
We posted SKEW yesterday as our “Indicator of the Day” but our video focuses on SKEW as a contra-buy indicator as opposed to a harbinger of volatility. You can video it here to understand it from the other direction:
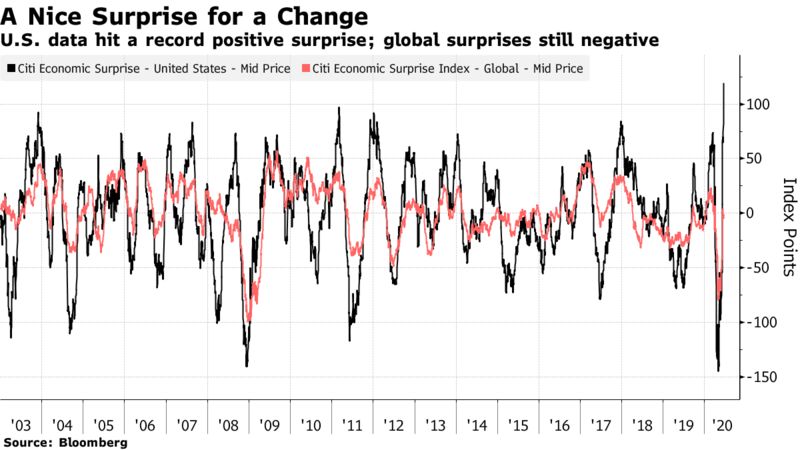
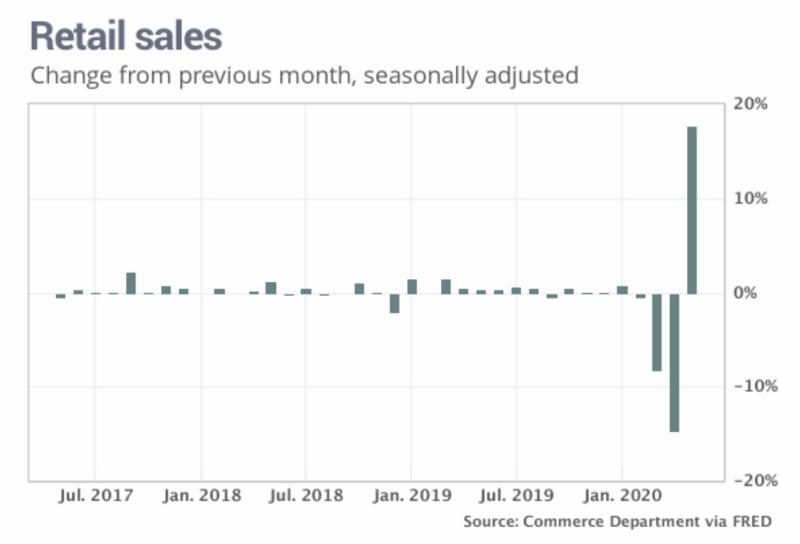
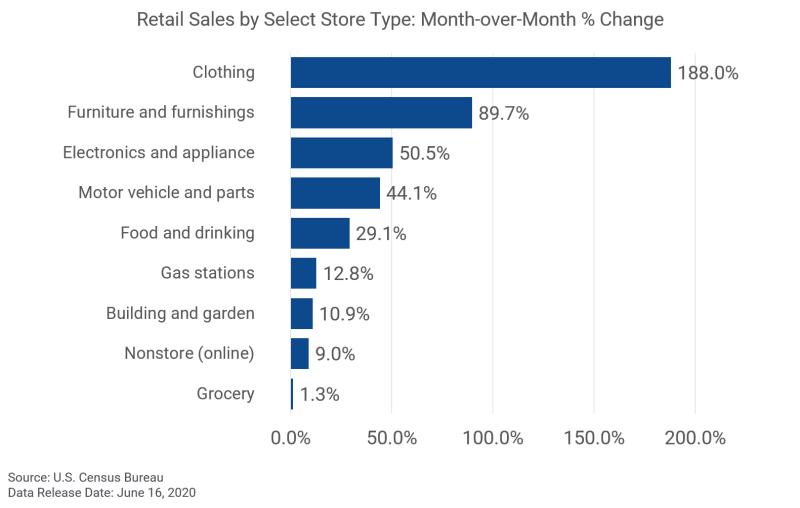
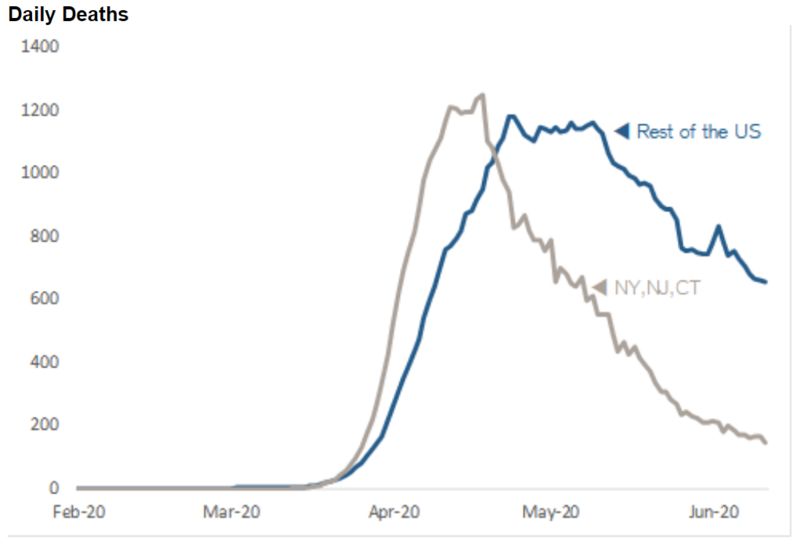
Continuing Signs of Recovery from this Week
Source: (on image. Bloomberg charts via John Authers)
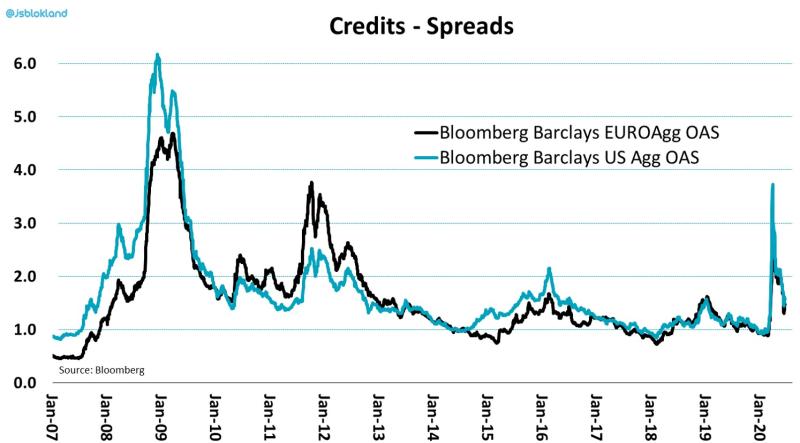 The Fed has saved the Credit Markets.
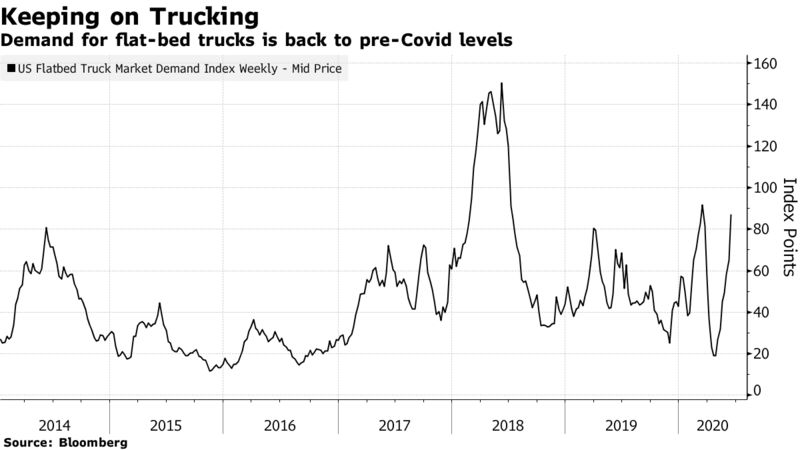
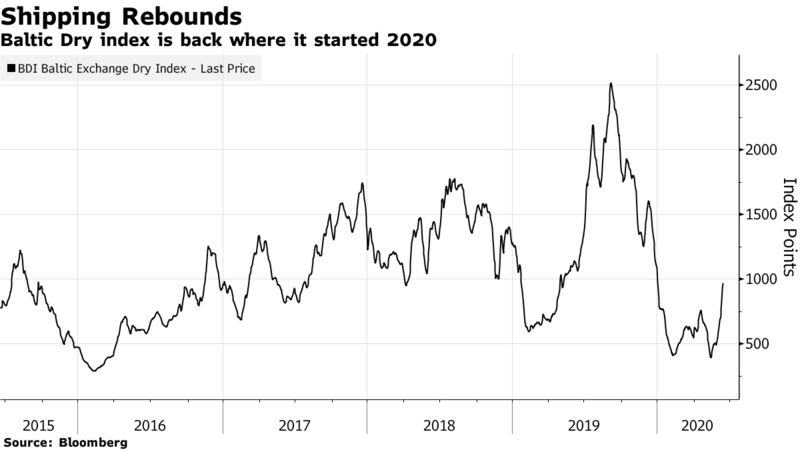
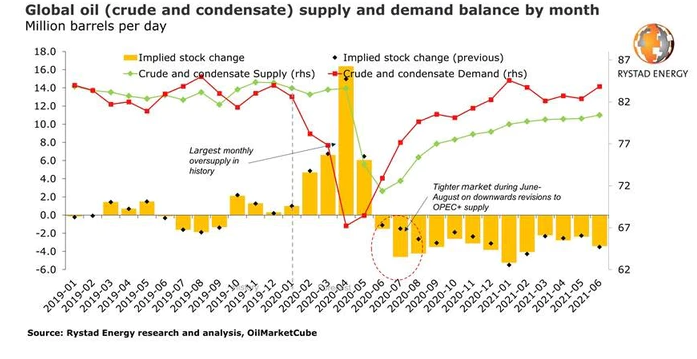
Expect to see the oil market tighten with demand pickups and continued supply cuts in coming weeks. This will be constructive for credit markets and the cyclicals rotation trade.
Now onto the shorter term view for the General Market:
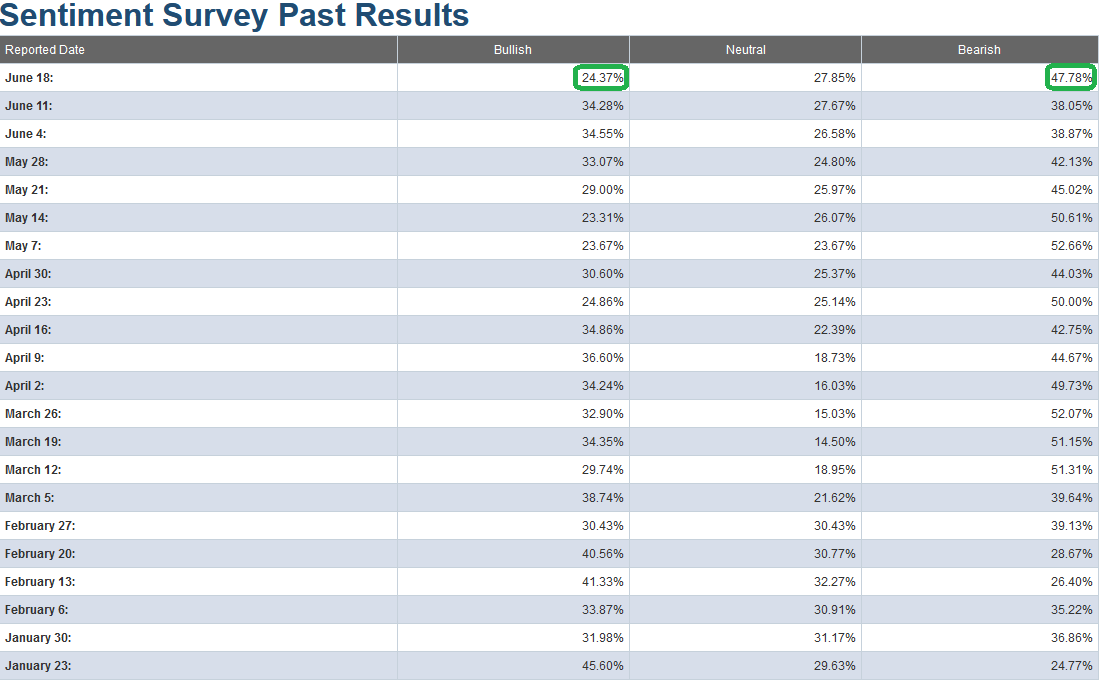
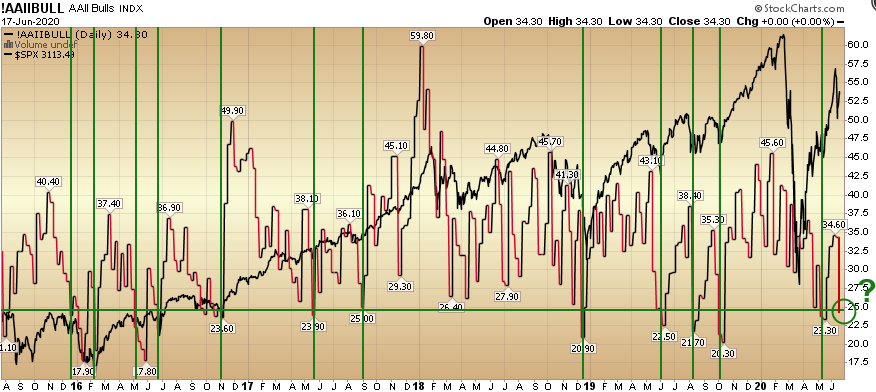
In this week’s AAII Sentiment Survey result, Bullish Percent (Video Explanation) collapsed to 24.37% from 34.28% last week. Bearish Percent also jumped to 47.78% from 38.08% last week. This was the biggest surprise of the week and also a level that historically favors being a buyer versus a seller. In the chart below I have annotated what the S&P 500 did after the “bullish percent” dropped below 25 (which is at/near an extreme level in pessimism).
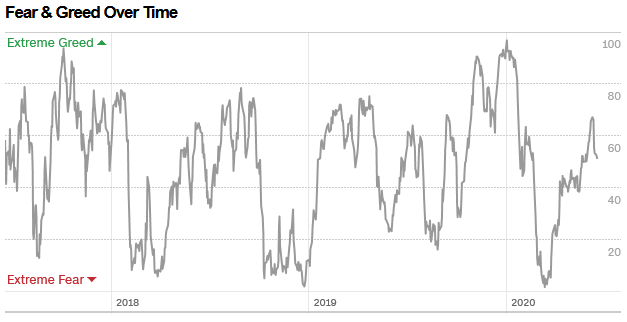
The CNN “Fear and Greed” Index slid back from 66 last week to 51 this week. Despite the market moving up 40+% off the lows, we have still not hit anywhere near an extreme/euphoric level (>80/90) yet. You can learn how this indicator is calculated and how it works here: (Video Explanation)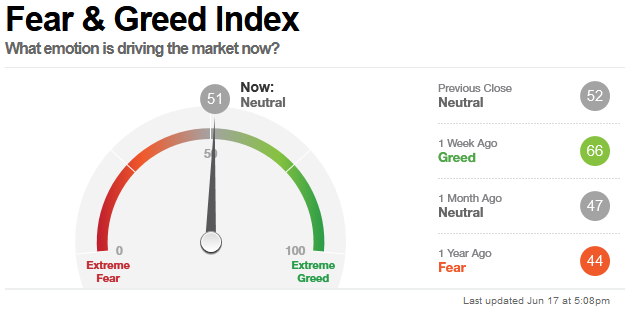
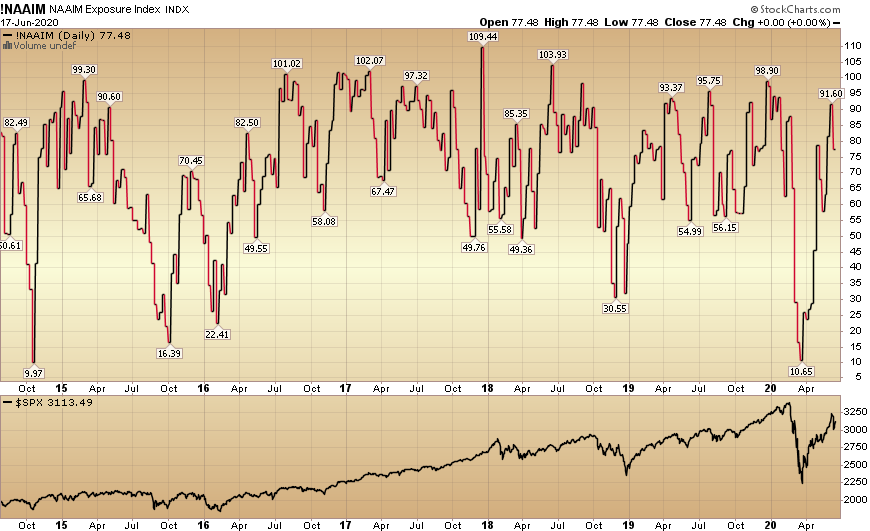
And finally, this week the NAAIM (National Association of Active Investment Managers Index) (Video Explanation) fell from 91.60% equity exposure last week, to 77.48% this week. After resisting much of the move in its early stages, active managers were shaken out after the one day drop last week.
Our message for this week:
Last week I said, “As I have made the case, we will likely get some mini pullbacks (3-9%) and sideways consolidation in coming months, but that does not mean we can’t push a bit higher first (despite being “overbought”).” The next day we got a 6% pullback (sooner and deeper than expected – but in line with the outlook)!
We used the weakness to add to laggards and cyclicals (those stocks that tend to have relative strength of performance coming out of recessions). We will do the same thing through the rest of the summer (adding on weakness). However, as I stated above, it appears there may still be a bit of gas in the “pain trade” higher now that we got the shakeout last week. We’ll take it day by day…
In case we forgot to mention it REPEATEDLY for the last eight to twelve weeks: We still like Banks and are looking to add MORE if the opportunity presents itself. For more on banks/yield curve, review our note from last week here:
The Carly Pearce “I Hope You’re Happy Now” Stock Market (and Sentiment Results)…
We also like and own pockets of Defense Stocks, Home Builders, Energy, and Small Caps. It will not be a straight line up, but over the next 6-18 months we believe we will see relative strength in these groups. This will happen as demand kicks in (more people continue to return to work) and the (what will be) >$10T of stimulus/aid/liquidity starts to circulate in the economy (velocity picks up).
We may see growth levels by 1H 2021 that would not be possible if not for COVID-19 – as we would never have this level of global FISCAL (and monetary) policy at play. The Fed is calling for 5% GDP growth in 2021.
We remain very constructive in the intermediate term and will take advantage of any additional buying opportunities in laggard/cyclical names – should they arise over the summer. In the interim we will hold what we have and shave only in the event we DO hit levels of euphoria that we have not seen since February.
While we’ve been doing the “Toosie Slide” sideways with Drake for the past 51 days, we are now due to move out of the range…


