

You’re a shining star
No matter who you are
Shining bright to see
What you could truly be
Listen to Earth, Wind & Fire – Shining Star here
Like all “shining stars” some are mistaken for “shooting stars” – which are actually rapidly moving meteors that burn up upon entering the Earth’s atmosphere.
In coming weeks, as companies start to report and give forward earnings guidance, we will get a better sense if this continues to be a “shining star” market, or if it was just a “shooting star.”
Increased Guidance on Tap?
In recent weeks we made the case that with the certainty of “phase one” behind us (nearly doubling exports to China off the high watermark of 2017 baseline), we could potentially see a situation where C-Suites ramp up investment/capex and slowly begin to take UP forward guidance. This statement sounded like it came from a martian just four weeks ago. With expectations of a 50bps bump to GDP as a result of the deal, increasing guidance is well within the realm of possibility.
Why is this important?
With forward guidance for the S&P 500 (as of 12/20) at $178.24 and Tuesday’s closing price of 3230.78, we are currently trading at 18.12x forward earnings. This is above the five year average of 16.6x, but below what would be an “end of cycle” multiple – which could rise closer to 19-21x or more.
However, it is not clear that this is “end of cycle” as I made the case for the possibility of both a 1998 AND a 1995 scenario – in last week’s note (which you can find below – next to the picture of Frank Sinatra).
So if earnings tick up a bit, we could keep our reasonable multiple (given the low discount rate), OR if earnings stay flat, multiple expansion to 20x forward would get us to ~3564 on the S&P 500 in 2020. But you will neither get 3564, nor multiple expansion in the absence of decent guidance coming out of earnings season. Earnings will either need to stay in this ballpark or potentially increase due to newfound visibility of improved trade relations with China.
What about sectors?
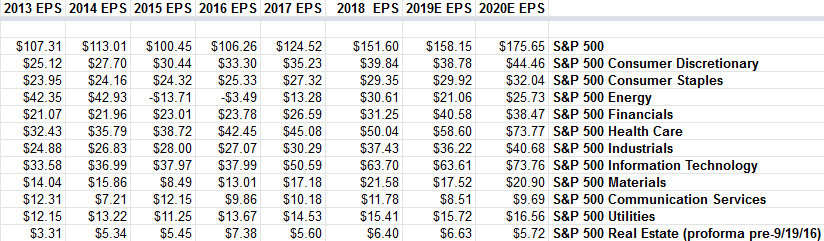
Data Source: S&P Global – Howard Silverblatt
Above I have posted Howard Silverblatt’s S&P 500 Operating Earnings numbers by sector.
What stands out to me on this table is that he has negative earnings growth estimates for Financials, Utilities and Real Estate in 2020. The remaining sectors are positive.
Operating Earnings versus Price (notable divergences)
1. Since 2016, earnings for the S&P 500 are up 65% through 2020. However PRICE is only up ~42.6% from the price peak in 2016 to the most recent price peak.
2. Operating Earnings for the Energy sector will nearly double in 2020 relative to 2017, yet price is trading down ~11% off the peak for XLE going into 2017.
3. Operating Earnings for the Healthcare sector have grown 106% since 2014. Peak price of the sector XLV has appreciated by 57.9%
Irrespective of what the general market indices do, there are pockets of opportunity where earnings growth has dramatically outpaced price growth. In those sectors and sub-sectors is where you’ll find us prospecting for golden opportunities.
We starting talking about the Exploration and Production sub-sector in October. It has moved up ~20% in the last few weeks and we still like it for 2020. You can review our most recent Energy thesis here. Inside this article you will find three other notes of paramount importance if you have interest in the sector for 2020:
The J. Paul Getty (Energy) Stock Market (and Sentiment Results)
The general indices performance will be a function of guidance and rates. Chair Powell has committed to do is part on rates until 2021 by holding off on raises and maintaining liquidity. He has injected ~$406B since August of this year.
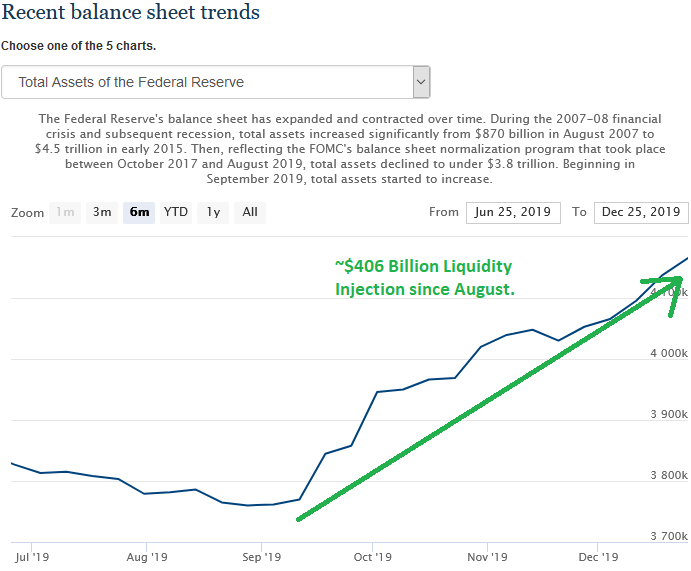
The question now will be if CEOs and CFOs step up investment/capex and guidance in coming weeks and months.
We covered CEO/CFO sentiment – and its implications – extensively in our note last week. You can review it here:
The “Fly Me to the Moon” Stock Market (and Sentiment Results)
Now onto the shorter term view:
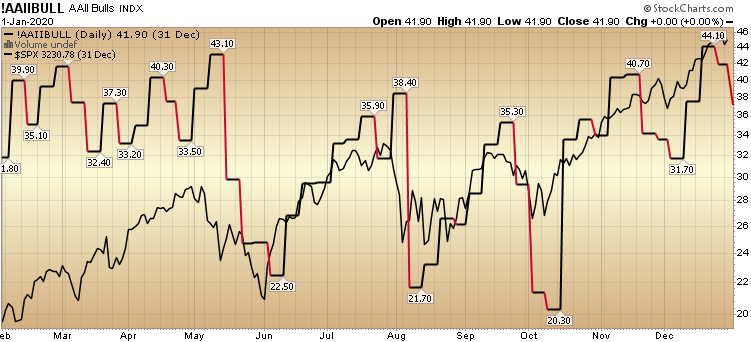
This week’s AAII Sentiment Survey result (Video Explanation) Bullish Percent came in at 37.22%, down from 41.89% last week. Bearish Percent rose modestly to 21.88% from 21.53% last week. Neutrality (confusion) jumped up to 40.91% – which is the highest level since the December 5 market bottom, and the October 3 market bottom (see chart below).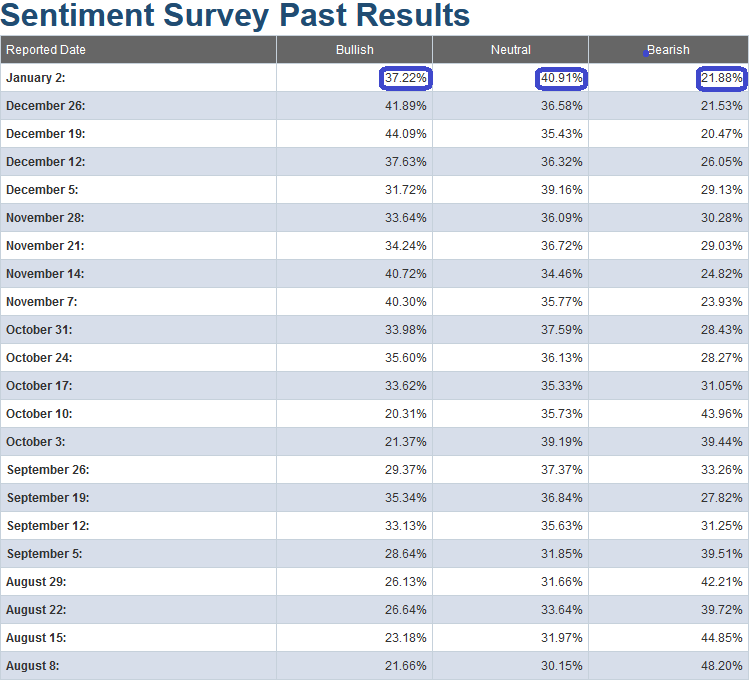
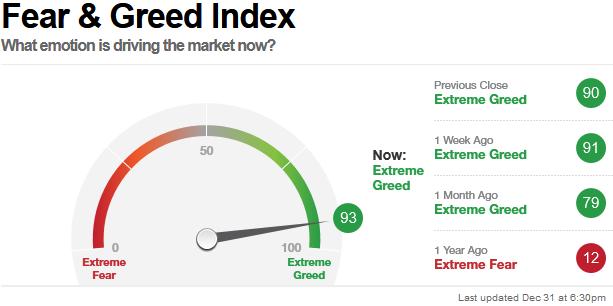
The CNN “Fear and Greed” Index – which rose 2 points (from 91 last week to 93 this week) did not confirm the drop in the AAII Sentiment Survey. It is at an extreme level. This is generally not the place you want to be adding a lot of NEW exposure unless it is in stocks/sectors that have not yet participated in the rally and have solid fundamentals. You can learn how this indicator is calculated and how it works here: (Video Explanation).
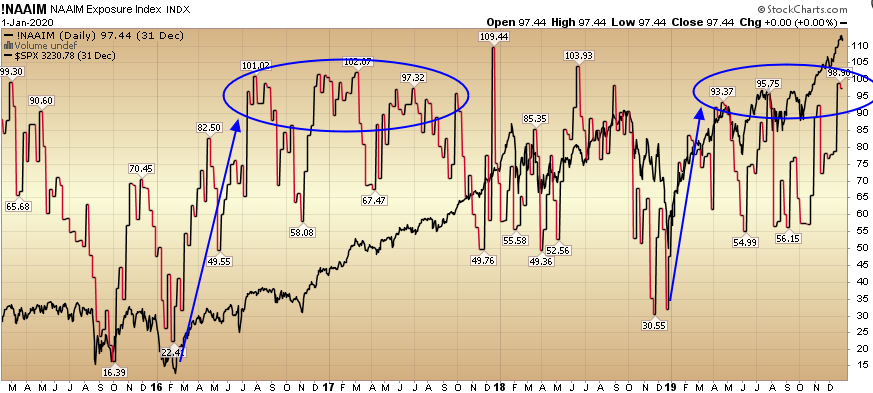
And finally, this week the NAAIM (National Association of Active Investment Managers Index) (Video Explanation Here) came in modestly to 97.44% (down modestly from 98.90% last week). While this is an elevated level, these levels can stay “pinned” for some time (similar to the 2016-2017) when they are emerging from a significant trough (like early 2016 and late 2018). For a more detailed explanation of “pinning” use the search bar on the right side of the site to find the “Katy Perry” article.
Our message for this week is similar to last couple of weeks:
We remain bullish in the intermediate term (for 2020), but as we have stated in our last notes, we have trimmed some names that have had huge runs off of the August/September lows, and had re-allocated some profits into sectors/stocks that had just begun to participate.
You can review our previous notes under the category “Sentiment” on the right side of the site.


