

In 1965, J. Paul Getty – once the richest man in America – published his book, “How To Be Rich.” His intent with this book was to lay out his “formula” for success and pass it on to future generations.
At the time of his writing, the energy sector (oil companies of his day) were trading at enormous discounts to their intrinsic value. He stated, “The wise investor will recognize that many stocks being offered on the market are still considerably underpriced. For example, there are many issues selling for as little as one-third or even one-fourth the net, per-share liquidation values of the issuing company’s assets.”
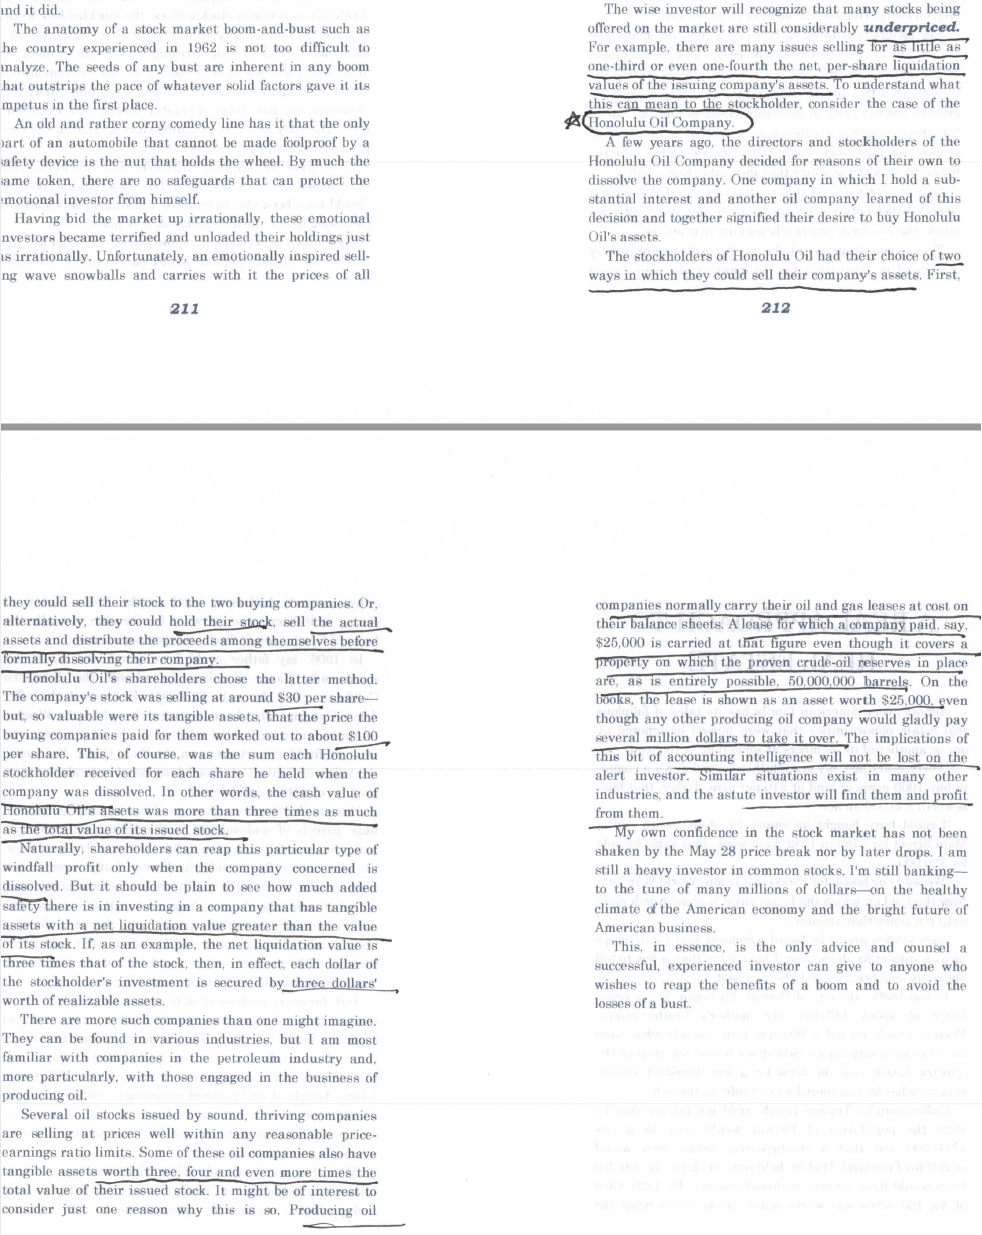
To illustrate his point, he laid out the case of the Honolulu Oil Company. The stockholders (and Board) recognized that the stock was trading at a substantial discount to its liquidation value but the stock remained subdued due to the sentiment around the sector and pessimism around oil at the time. The stock was trading at $30 per share and the Board had calculated they could sell the assets for $100 per share if they liquidated the company and distributed the proceeds to shareholders.
That’s exactly what the board voted to do. Rather than wait for the stock to trade up to its intrinsic value, they voted to dissolve the company and the shareholders each received $100 for every share they held that was trading around $30. As Getty puts it, “in other words, the cash value of Honolulu Oil’s assets was more than three times as much as the total value of its issued stock.”
He goes on to say, “Several oil stocks issued by sound, thriving companies are selling at prices well within any reasonable price-earnings ratio limits. Some of these oil companies also have tangible assets worth three, four and even more times the total value of their issued stock…the astute investor will find them and profit from them.”
Getty’s sentiment was also noted in a Fortune Magazine article from the 60’s (secondhand paraphrase):
“He said people think he made the billion in the oil business, and he said, I did, but not from my own oil companies. I could get a good deal sometimes, but never a great deal from another oil man, who always knows what his oil is worth. BUT THEN I DISCOVERED WALL STREET, THAT HAS NO IDEA WHAT THEIR MERCHANDISE IS WORTH ON A DAY TO DAY BASIS, and that’s when I got wealthy, buying stocks often at half or less their value, and just waiting till they got in vogue and they would then trade at 2x their value at which time I’d gladly sell, with 4x more money and wait for the cycle to repeat.”
In this article by Robert Lubar from 1986 (Fortune Magazine), Getty’s strategy was further clarified (Fortune):
“Bargain-hunting served Getty well in developing a strategy for his oil business. Back in the 1920s, he used to explain, oil companies’ stocks were selling above book value and were overpriced. It was cheaper to buy leases and drill for oil, which he did with considerable success in the fields then opening up along the California coast. In the 1930s, after the stock market crash, Getty realized that he could pick up oil company shares at prices representing only a fraction of the value of the oil in the ground. He considered it ”foolish to buy oil properties with 100-cent dollars when you could buy them indirectly with maybe 50-cent dollars.” Accordingly, Getty staked everything he owned or could borrow on the underpriced shares of a number of small oil producers.”
What do you think J. Paul Getty would say about our current situation?
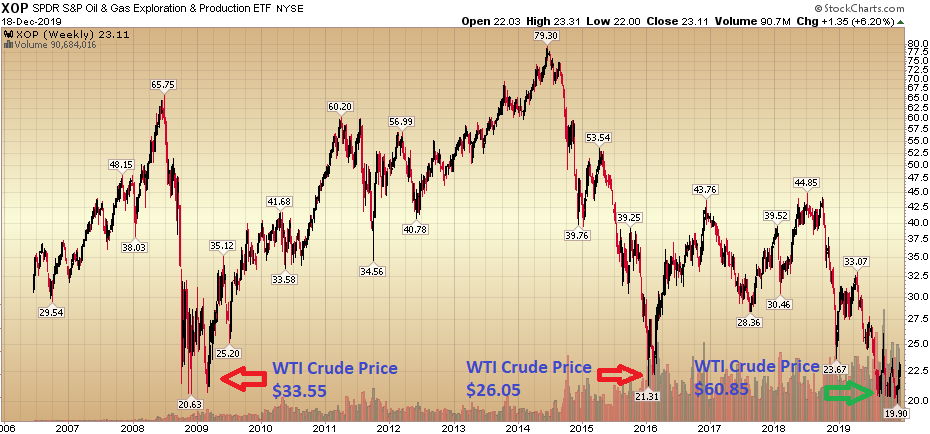
The Exploration and Production Sector (Basket of Stocks – ticker: XOP below) is trading at “Great Financial Crisis” lows of 2009, and “Energy Sector Depression” lows of 2016. The difference is, WTI crude traded down to $33.55/bbl and $26.05/bbl during those periods respectively. It is trading at ~$60/bbl now with most producers’ current breakeven at less than $50/bbl.
Floyd B. Odlum:

On November 30, we pointed out (in our daily “key reads”) an article about another wealthy investor of his time named Floyd B. Odlum. Floyd was the greatest value investor you’ve never heard of. You can find the article here (Macro Ops).
After losing all of his $40,000 of starting capital (over $500,000 in today’s dollars), Odlum retreated from the markets for a while. Some time later he scraped together another $39,000 and grew it to $6M between 1923 – 1929. That’s a total return return of 15,284% or a CAGR of 2,547% per year during that period. Over subsequent years he grew his Assets Under Management to $150M or ~$2.2B in today’s dollars. Like Getty, he was among the wealthiest Americans of his time.
Also like Getty, Odlum shared a penchant for buying stocks that traded at a significant discount to their intrinsic value – which from time to time (in the normal boom/bust cycle of the sector) led him to energy stocks.
 In a summary of his biography, David Clarke, Jr. relays the story of Odlum’s investment vehicle (Atlas) buying oil stocks at a discount:
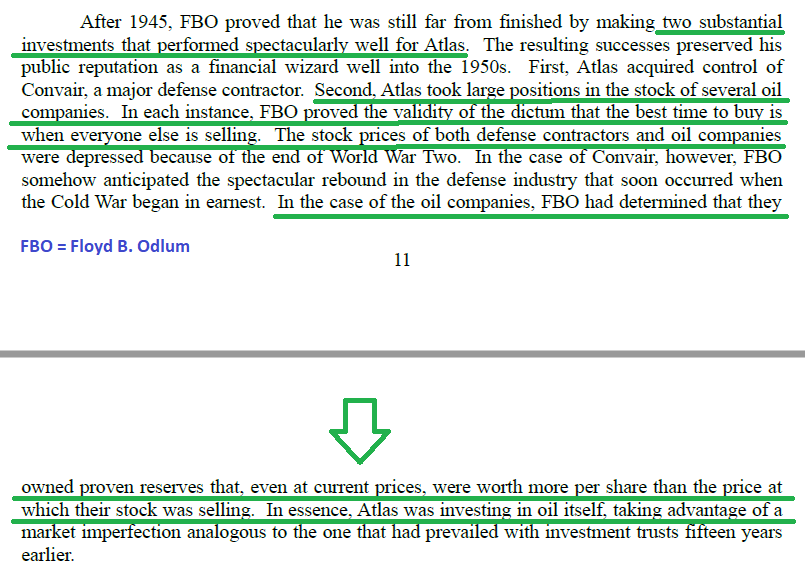
“Atlas took large positions in the stock of several oil companies. In each instance, FBO (Floyd B. Odlum) proved the validity of the dictum that the best time to buy is when everyone else is selling.” In this case the oil companies were depressed because of the end of World War Two.
However, Odlum determined, “that they (the oil companies) owned proven reserves that, even at current prices, were worth more per share than the price at which their stock was selling. In essence, Atlas was investing in oil itself, taking advantage of a market imperfection” (that had the stock temporarily trading at a huge discount to its liquidation value).
On October 12, I believed a similar scenario was developing in the Energy Sector (as defined by Getty and Odlum). I posted this article to explain the Energy Sector thesis:
Snake OIL? How Portfolio Managers View Exploration & Production Stocks…
At that time, the Exploration and Production Sector ETF (Ticker: XOP referenced in the article) was trading at $21.09.
I subsequently followed up with a more comprehensive article on the thesis on December 5 – when XOP was trading at 20.41.
The Taylor Swift “Bad Blood” Energy Market (and Sentiment Results)
In the same week I was quoted in a Financial Times article by U.S. Markets Editor Jennifer Ablan, which further ellaborated on the thesis:
Here is what has happened to the Exploration and Production Sector (ticker: XOP) in the past two weeks:
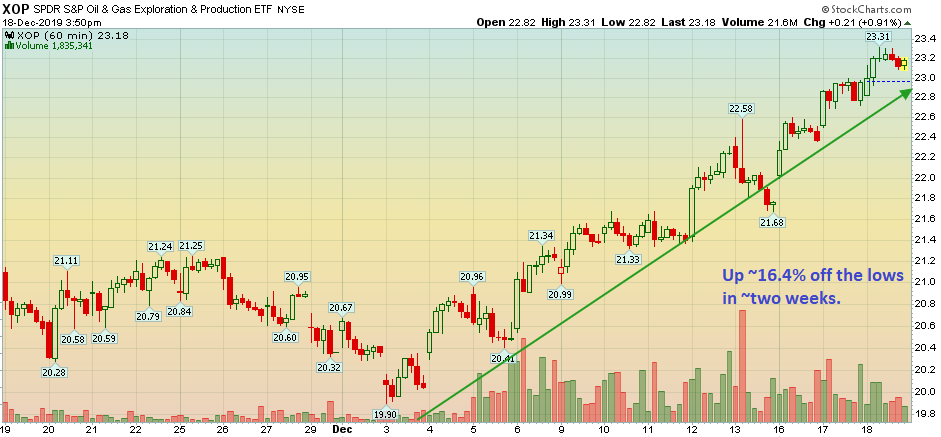
The basket of stocks is up ~16.4% in ~2 weeks and up ~10% since the original article. That’s the good news. The bad news is that it doesn’t really matter as one has to take a long term view for this thesis to play out (think in terms of 3-5 years versus 3-5 days or weeks).
In the Financial Times article I said,
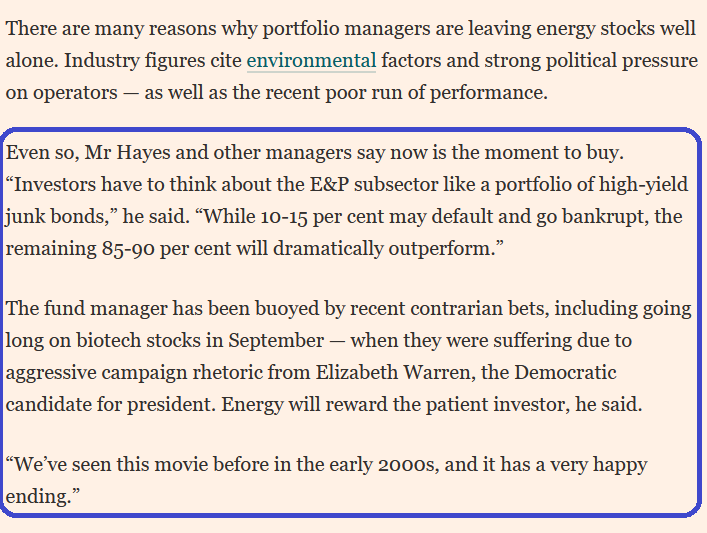
So while it will be nice if the group continues to perform well in the short term, the energy sector is fond of taking in new money after a quick run-up then dumping the late-comers before moving higher again (so patience will be paramount). The key is to know what you are buying and buy a basket (as the fear in the sector is based on defaults/leverage – which we covered extensively in the “Bad Blood” article above).
In other news, the Biotech sector has continued to perform well since our call in September. We lightened up, but have still kept some exposure to the general index and a couple of selected names:
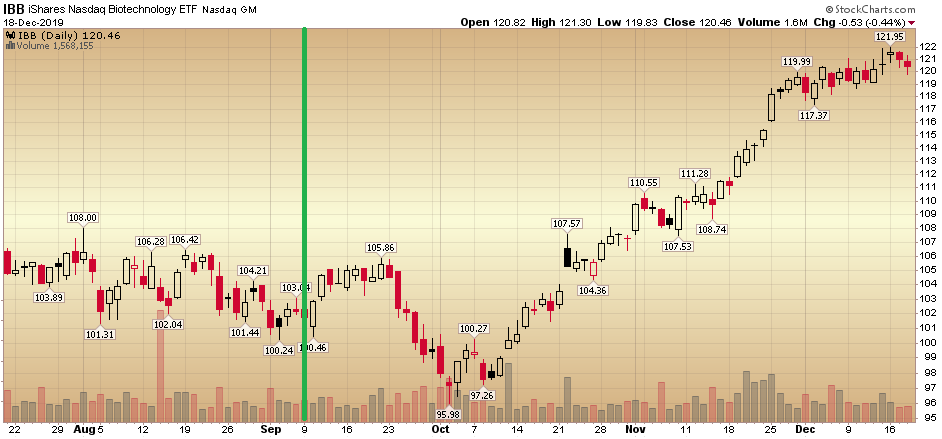
Original thesis from mid-September here:
As is always the case in markets, there are no guarantees. All you can do is do your homework and make probabilistic decisions based on the data at hand, monitor new data as it comes in, and manage risk. If/When the facts change, be prepared to change your mind and take nothing for granted as the market has a tendency to discipline us when we lose our flexibility.
Shifting now to the general market, this week Bank of America put out its monthly “Global Fund Managers Survey.” We posted our summary here:
SUMMARY OF BoA Survey (click above for more details):
- Managers buying equities generally, banks, energy stocks, and commodities.
- Cash levels at 6 year low. Rally continued last time cash was at this level in 2013.
- Huge 2 month jump in profit expectations (last matched in May 2009 – or the beginning of the post-crisis bull market).
- Record two month jump in global growth expectations.
2020 Earnings Are Holding Strong:
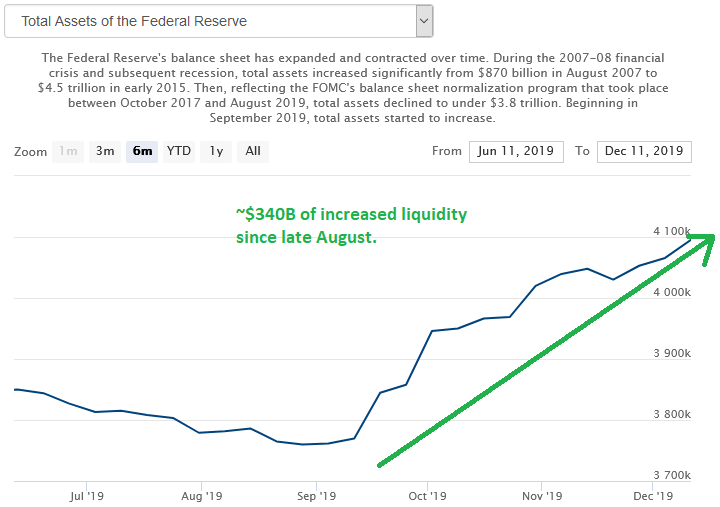
The Fed remains ACCOMMODATIVE:
Now onto the shorter term view:
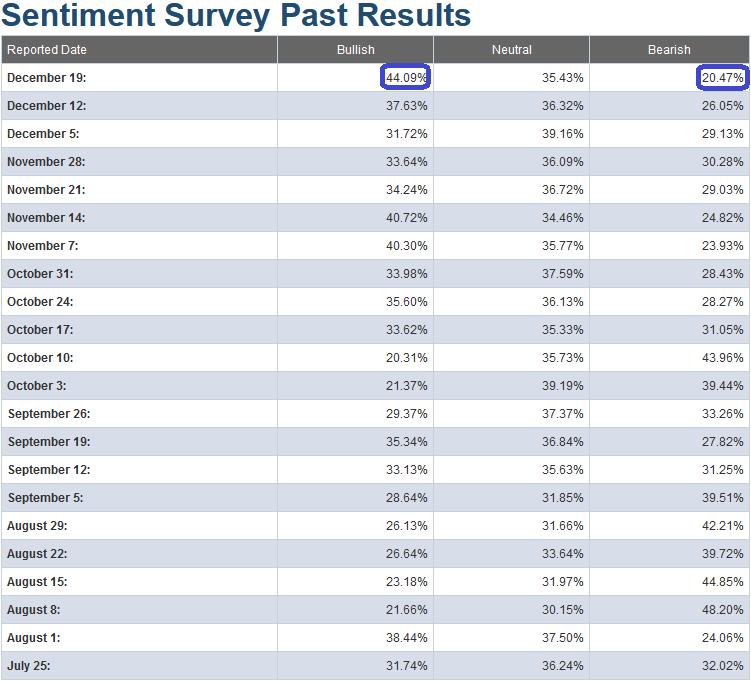
This week’s AAII Sentiment Survey result (Video Explanation) Bullish Percent came in at 44.09%, up from 37.63% last week. Bearish Percent dropped to 20.47% from 26.05% last week. This is showing early signs of euphoria among retail investors. As a general rule, this is not the time that you want to be adding a lot of new risk to your portfolio unless it is in sectors/stocks that have solid fundamentals and have not yet participated in the rally.
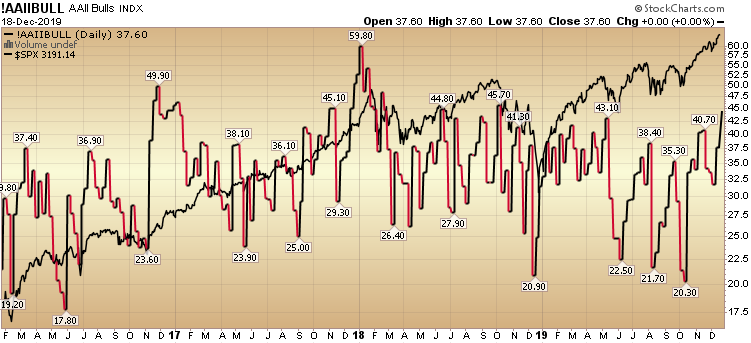
That said, we have talked about the concept of “pinning” of overbought indicators for many weeks now. When the “chase for performance” is on (particularly at year-end), it is possible for overbought indicators to stay pinned while the market keeps rising. We suggested this might happen 6 weeks ago, and it has:
The Katy Perry “Hot ‘N Cold” Stock Market (and Sentiment Results)
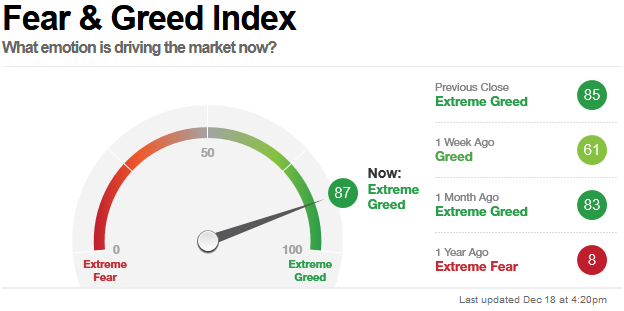
This jump in sentiment was confirmed by the CNN “Fear and Greed” Index – which jumped 26 points (from 61 last week to 87 this week). This is at/near an extreme level. It is generally not the place you want to be adding a lot of NEW exposure unless it is in stocks/sectors that have not yet participated in the rally and have solid fundamentals. You can learn how this indicator is calculated and how it works here: (Video Explanation).
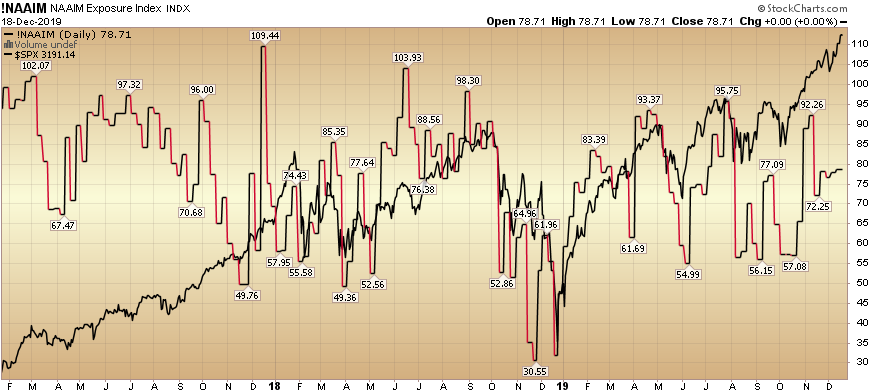
And finally, this week the NAAIM (National Association of Active Investment Managers Index) (Video Explanation Here) flat-lined at 78.71% (up modestly from 77.80% last week). This implies that managers are still somewhat underweight equities and will have to gain further exposure to attempt to catch their benchmarks. It is an offsetting factor to the retail indicators above (AAII and CNN Fear & Greed).
Our message for this week is similar to last week:
We remain bullish in the intermediate term, but as we have stated in our last note, we have trimmed some names that have had huge runs off of the August/September lows (like our call on Biotech in September), and have re-allocated some profits into sectors/stocks that have just begun to participate (like energy – among others).
Not Investment Advice. See “Terms” above.


