
In the past week, sentiment on the Energy Sector has sunk to an all-time low (despite having the highest estimated earnings growth of any sector – for 2020). Several prominent market figures have even called for the end of the sector.
Mark Twain once said, “Reports of my death have been greatly exaggerated.”
The origin of the story (according to writingexplained.org) is that “in the year 1897, Mark Twain was in debt. He had decided to travel to London in order to do a speaking tour, in order to earn more money and pay off his debts.
Somehow, a rumor began that he was sick, and the rumor grew until many people believed he had died. According to legend, a reporter found Mark Twain, and asked him what comment he had about the rumor that he was dead. The quote above is how he chose to reply.”
For anyone following my commentary, you know we have been building a position in the exploration and production sub-sector on any weakness since mid-October. You can find our last article here (which includes every note we have written since October 12, 2019):
The J. Paul Getty (Energy) Stock Market (and Sentiment Results)
I don’t take it lightly when credible people – with track records of success – are on the other side of a trade than I am. After adding to our position on Friday, I decided to spend the weekend in an effort to burden myself with the facts. Does it make sense to remain overweight this sector relative to the benchmark and how does the data support that positioning?
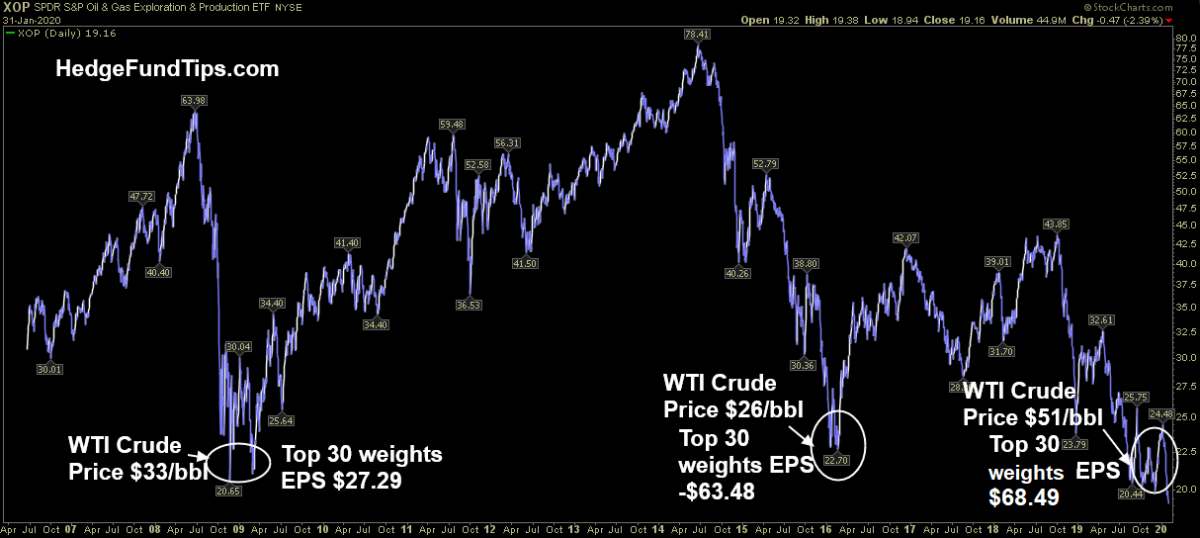
In the featured chart above I have annotated a longer term chart of the Exploration and Production (Energy Sub-sector) as represented by the tracking ETF (Ticker: XOP). I wanted to discern “price” relative to the underlying fundamentals. To do so I harvested data from the top 30 weights of the sub-sector that had comps during the last two crisis periods for the industry (2009 “Great Financial Crisis” Lows and 2016 “Oil Depression” Lows). Here are the results:
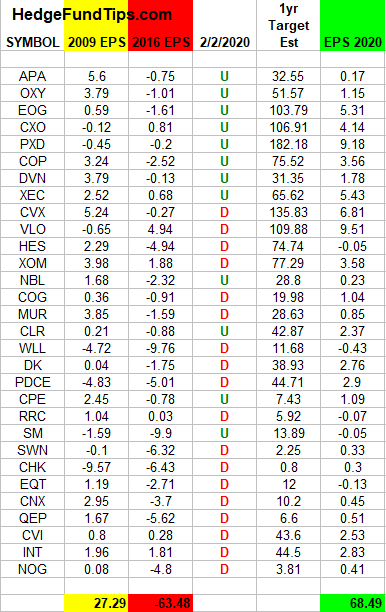
To my surprise, they were much better than expected. The basic summary is that the sub-sector is trading down to 2009 and 2016 lows despite having 150% greater earnings power than both periods. It is trading at the same levels as 2016 despite having $131.97 more of earnings power in the aggregate.
Keep in mind, in 2009 WTI crude traded down to ~$33/bbl and in 2016 it traded down to ~$26/bbl. WTI crude is trading ~$51/bbl right now.
Why is this significant?
Let’s put it in simple terms:
If you could buy a $1,000,000 apartment building in 3 different scenarios, which one would you buy:
a) A $1M apartment building that yields $270,000 in rental income.
b) A $1M apartment building that yields $0 in rental income and costs you $630,000 in repair expenses for the year.
c) A $1M apartment building that yields $680,000 in rental income.
If you chose “C” you made the equivalent choice to buying the exploration and production index at today’s prices. Sooner or later this type of divergence resolves itself (we are betting to the upside).
The bears on the other hand (to be short at these prices) have to be betting that 2020 EPS estimates will decline by at least 60% to get to today’s price. I’m on the other side of that bet because even if estimates come down 50% the basket is still dramatically under-priced in our view.
Yesterday morning I made this case on Yahoo! Finance TV. You can watch the segment here:
I went into further granularity on TV regarding OPEC, leverage ratios, Billionaire Buyers, among other points you will want to hear if you are exploring the sub-sector. I would also recommend clicking on the article referenced earlier (which includes everything we have written on the subject).
Now onto the shorter term view for the General Market:
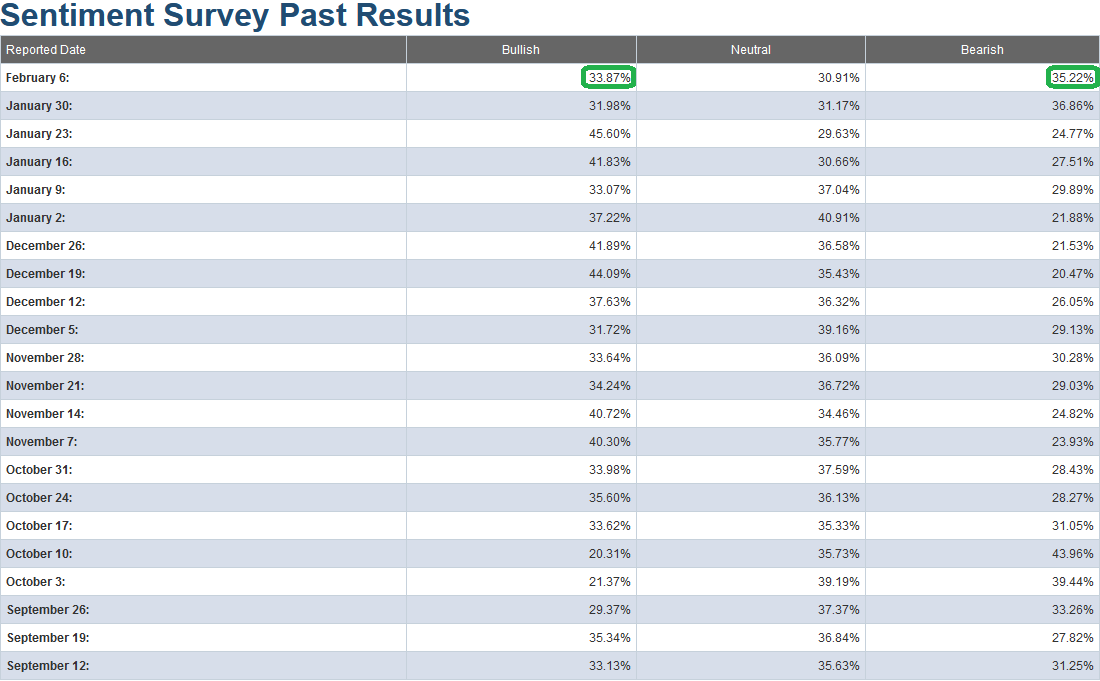
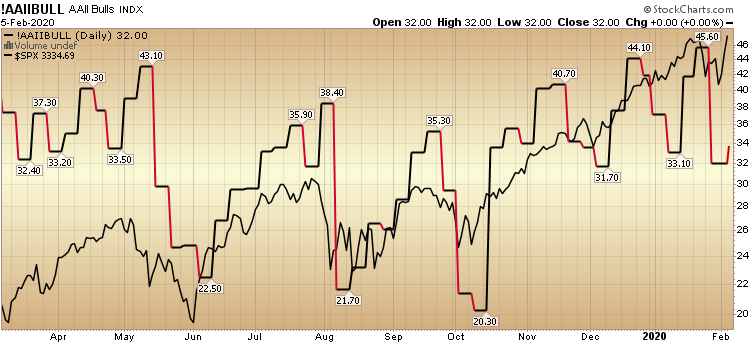
This week’s AAII Sentiment Survey result (Video Explanation) Bullish Percent rose to 33.87% from 31.98% last week. Bearish Percent fell to 35.22% from 36.86% last week.
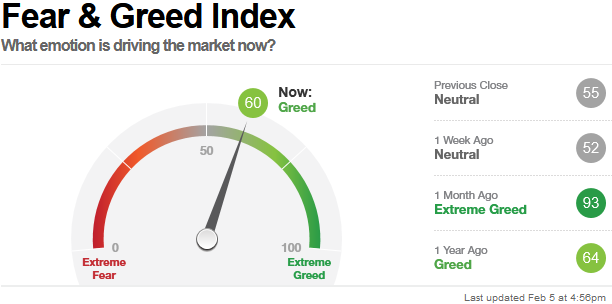
The CNN “Fear and Greed” Index – which rose 8 points (from 52 last week to 60 this week) confirmed the rise in the AAII Sentiment Survey. You can learn how this indicator is calculated and how it works here: (Video Explanation)
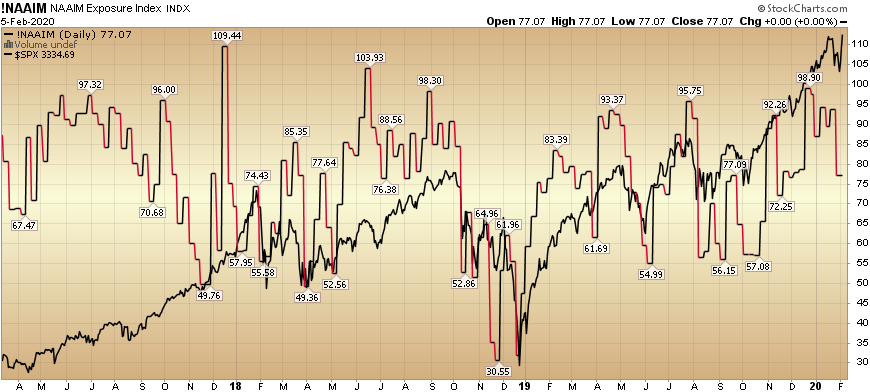
And finally, this week the NAAIM (National Association of Active Investment Managers Index) (Video Explanation Here) dropped from 93.75% equity exposure last week, to 77.07% this week. Managers will have to play “catch-up” once again if we get follow-through on this week’s move.
Our message for this week is similar to the last couple of weeks:
We remain bullish in the intermediate term (for 2020). As we have stated in our recent notes, we have trimmed some names that have had huge runs off of the August/September lows, and had re-allocated some profits into sectors/stocks that had just begun to participate.
We also recently added a few selective shorts. The short positions are not due to bearishness per se, but rather “special situations” that we believe will work even in a sideways to up market and outperform in the event of a pullback.
You can review our previous notes under the category “Sentiment” on the right side of the site.


