
This week we chose Lionel Richie’s classic song, “Dancing on the Ceiling” to embody the sentiment of the Stock Market. The salient lyrics are as follows:
What is happening here
Something’s going on that’s not quite clear
Somebody turn on the lights
We’re gonna have a party
It’s starting tonight
Oh, what a feeling
When we’re dancing on the ceiling
Oh, what a feeling
When we’re dancing on the ceiling
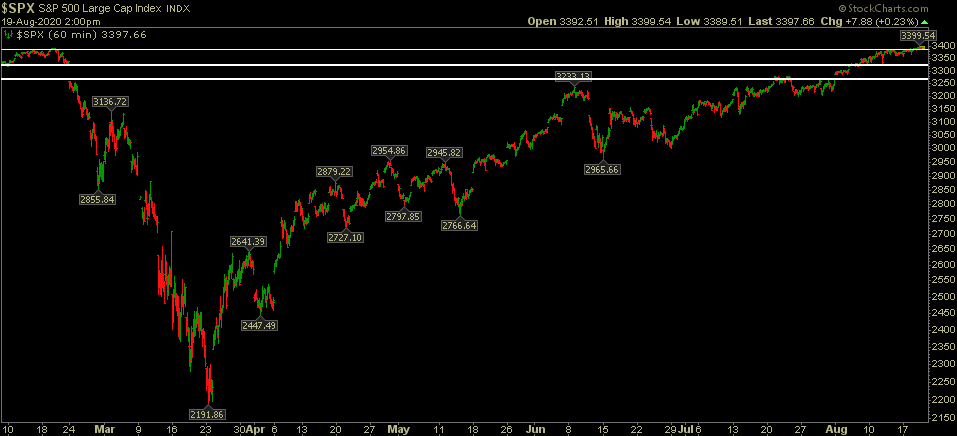
In recent weeks we discussed filling the late February “gap” and then proceeding to make new highs on the S&P 500. We have now accomplished both objectives.
While the implication and consensus is that we are at a short term top, that is not clear when we look under the surface.
It is a Dickensian, “Tale of Two Markets” when you look under the surface. So while it may be true that the general indices could be due for a rest in coming weeks, such a rest may be accompanied by “under the surface” rallies in laggard/unloved sectors. In other words, the conditions that would cause a pullback in the heaviest weighted names (FAANGM) would potentially be favorable to those sectors that don’t look anywhere near “overdone.”
So while some stocks and sectors may be “Dancing on the Ceiling” and tasting shades of euphoria, other sectors are firmly planted on the floor and ready to launch. So, “what do you think of the market?” is less interesting of a question than, “what do you think about banks, commodities, emerging markets, defense stocks, tech, etc?”
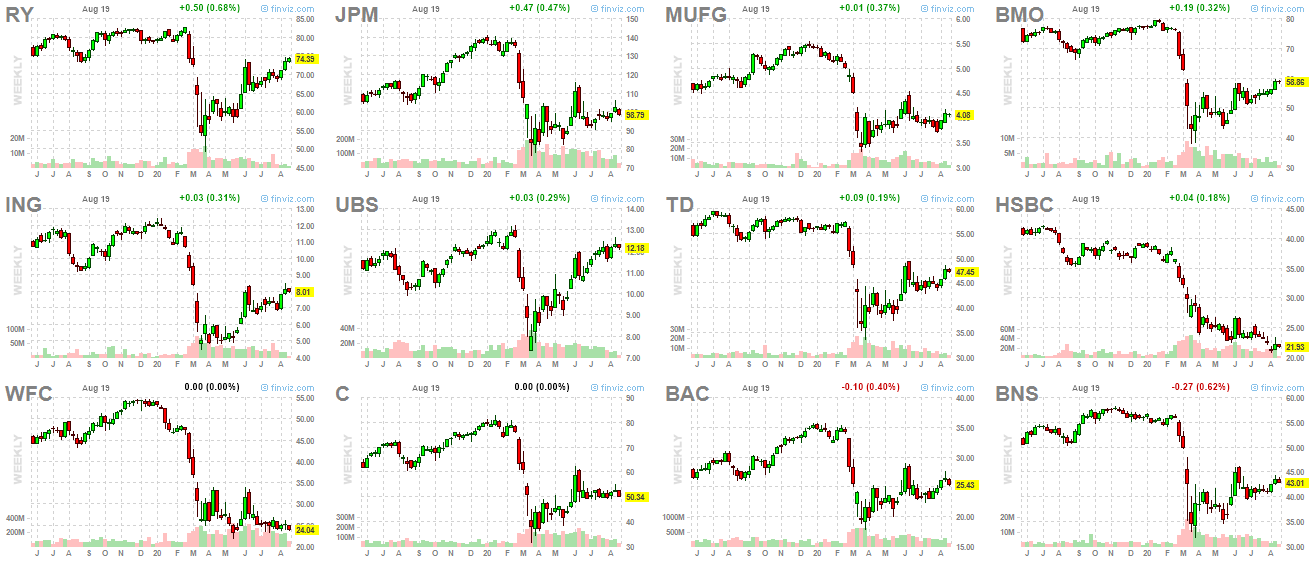
For example, do these banks look “toppy” to you? Any signs of euphoria here?
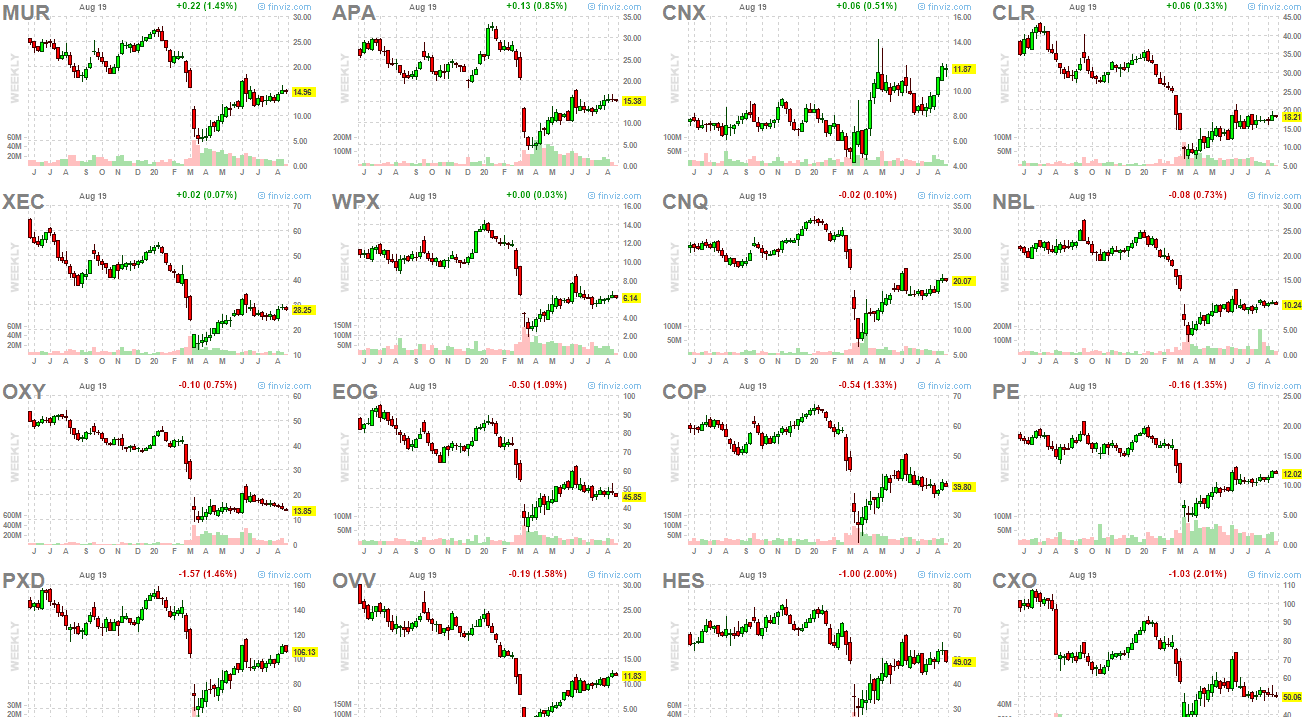
Bid for Energy too frothy?
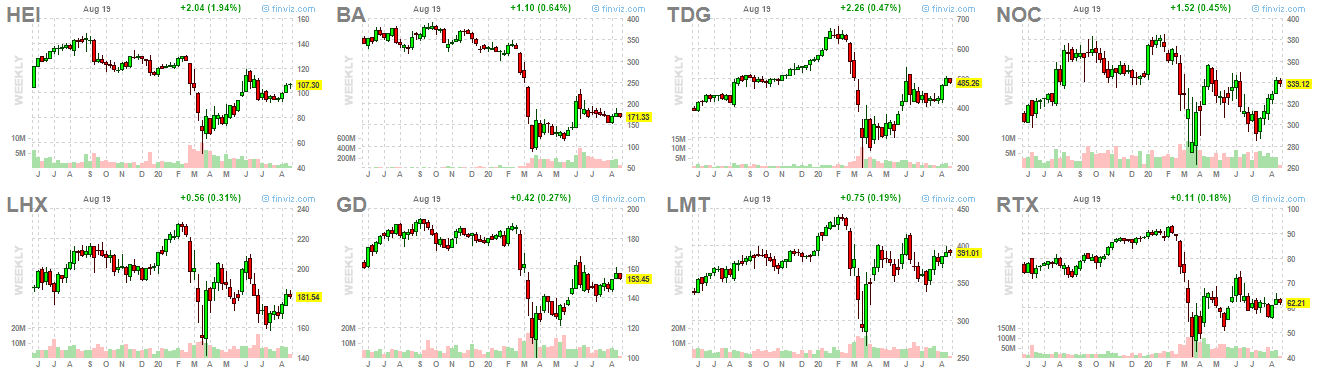
How about Defense and Aerospace? Dancing on the ceiling or floor?
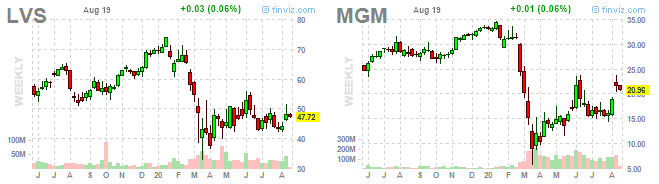
Casinos and Airlines?
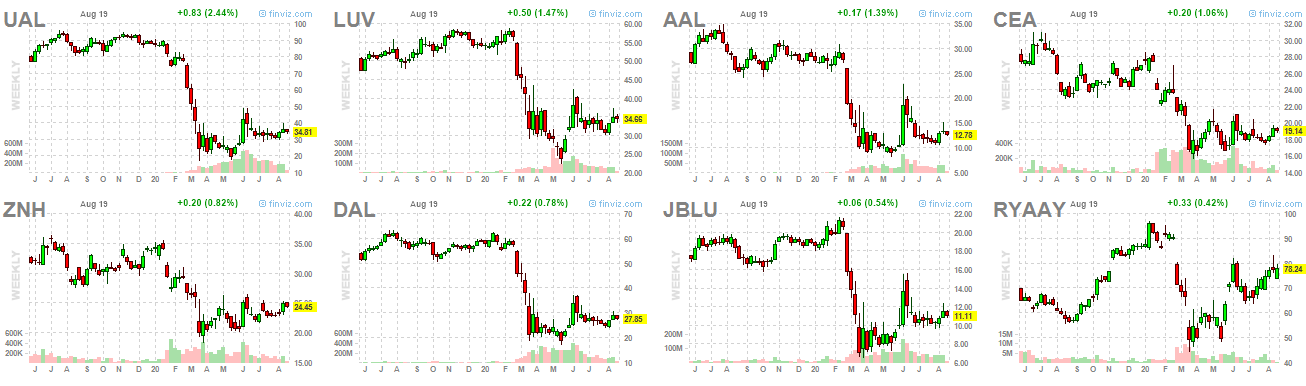
How does that compare to this basket of Semiconductor/Tech/Internet stocks?
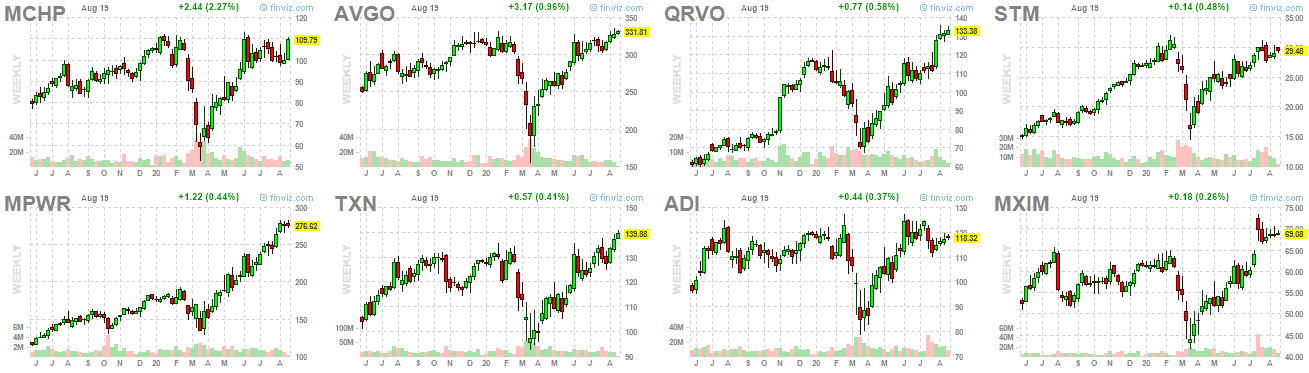
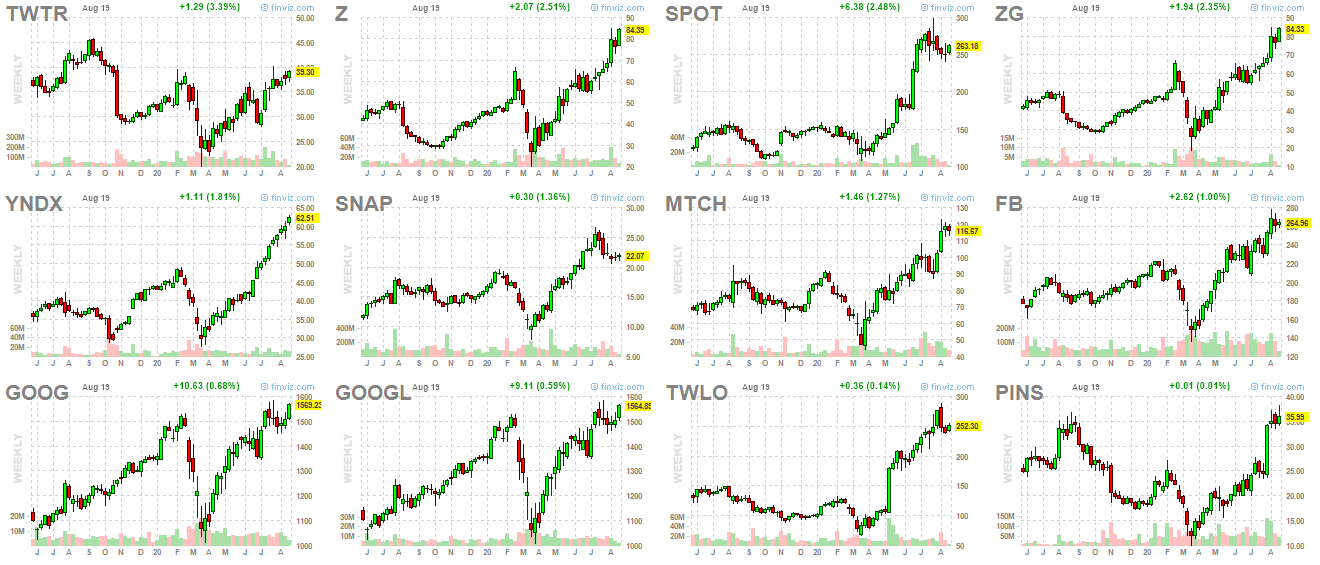
Source: Random Mid/Large Cap+ Selection From Each Sub-Sector on Finviz.com
What condition would have to materialize to see the “Dancing on the Floor” stocks become the new “Dancing on the Ceiling” stocks and cause the “Dancing on the Ceiling” stocks to sit out one or two songs in coming months (causing a general indices pullback due to their weighing)?
- Announcement of a vaccine, or major breakthrough that pointed to near certainty and timeline on vaccine/treatment. This would shift consensus FROM slower recovery/growth (lower rates) – which benefits tech – TO faster recovery/growth (slightly higher rates) – which benefits cyclicals. The only thing holding back record GDP growth (considering the amount of stimulus in the system and M2 money supply growth in the last few months) is certainty on timeline of when normalcy will return. That is a function of the virus – and each day that passes – we get closer to resolution.
- When these groups turn, it will be abrupt – and most people will be chasing banks after they are trading at a 50-100% premium to book versus buying now – in many cases – at a discount to book. They won’t believe the move (in all laggard cyclical groups) because there have been too many “Fake Outs,” but the move will be real and they will “pay up” AFTER moves of 50-100% because the S&P weights will have grown and forced them (closet indexers) to participate late rather than early.
How do we know? Because it happens coming out of every single historical recession. There is no recovery without Banks/Cyclicals leading out of the gate (early/high growth stages). No credit growth, no recovery. Banks are the transmission mechanism…
What About Sentiment:
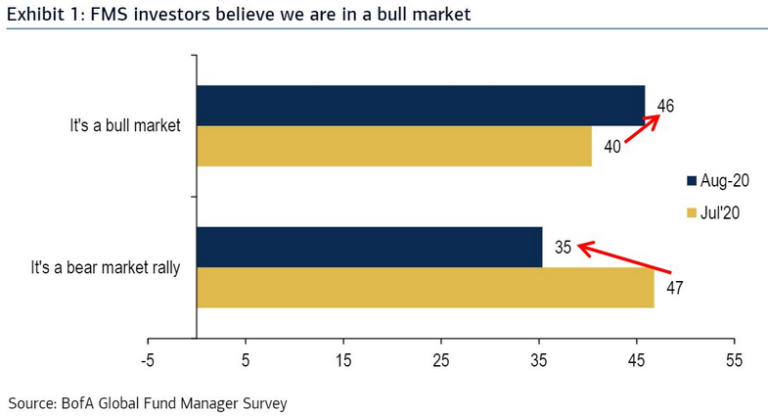
This week we put out a summary of Bank of America’s monthly “Global Fund Managers Survey.” They question ~200 managers overseeing ~$500B AUM. You can review it here:
August Bank of America Global Fund Manager Survey Results (Summary)
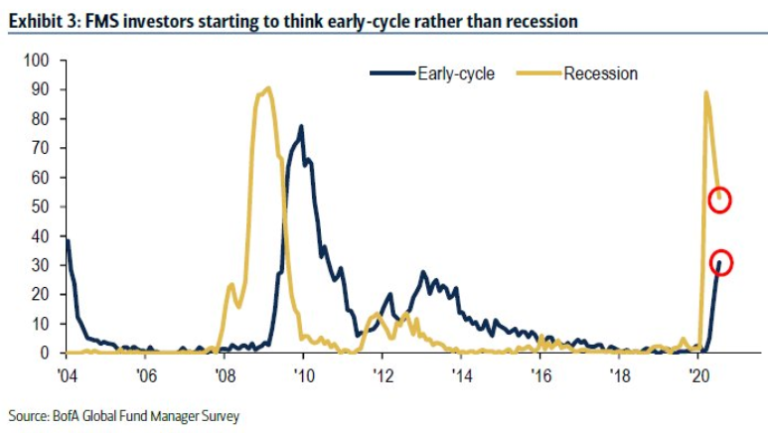
The key takeaway is that AFTER a 51% move off the lows, managers now feel this is not a “bear market bounce” after-all and in-fact the beginning of a new cycle. As I learned from the first Hedge Fund I worked at, “Opinion Follows Trend.”
Of Further Note:
- 79% expect stronger economy. Highest since 2009 (beginning of last cycle).
- The Enthusiasm is still tempered as just 17% forecast a quick, V-shaped economic recovery.
- This tempered view is buttressed by Managers expectation that the 10-year Treasury yield will be lower than 0.5% by year-end.
- More Skepticism: Respondents see an equal-weighted portfolio of equities, bonds and gold as the most overvalued since 2008.
- 57% expect higher profits in the next year. Up 21 percentage points and at the highest level since March 2017.
- BofA Proprietary Bull & Bear Indicator up to 3.7 “far from excessively bullish.”
- Cash levels down to 4.6% but in neutral range (<4% = greed, >5% = fear)
- Eurozone is now the most popular equity region among the poll’s investors: Allocation increased 17 percentage points to a 33% overweight. This is the highest since Spring 2018.
- Emerging Market equities rose 11 percentage points to (net 26% overweight).
- Exposure to U.S. stocks declined 5 percentage points (net 16% overweight).
- Managers expect to rotate their investments into Europe, Emerging Market Equities, Banks, Small-Cap and Value Stocks.
What we are seeing is perfectly embodied by these three signal charts put out by the @Leuthold group (Twitter) today:
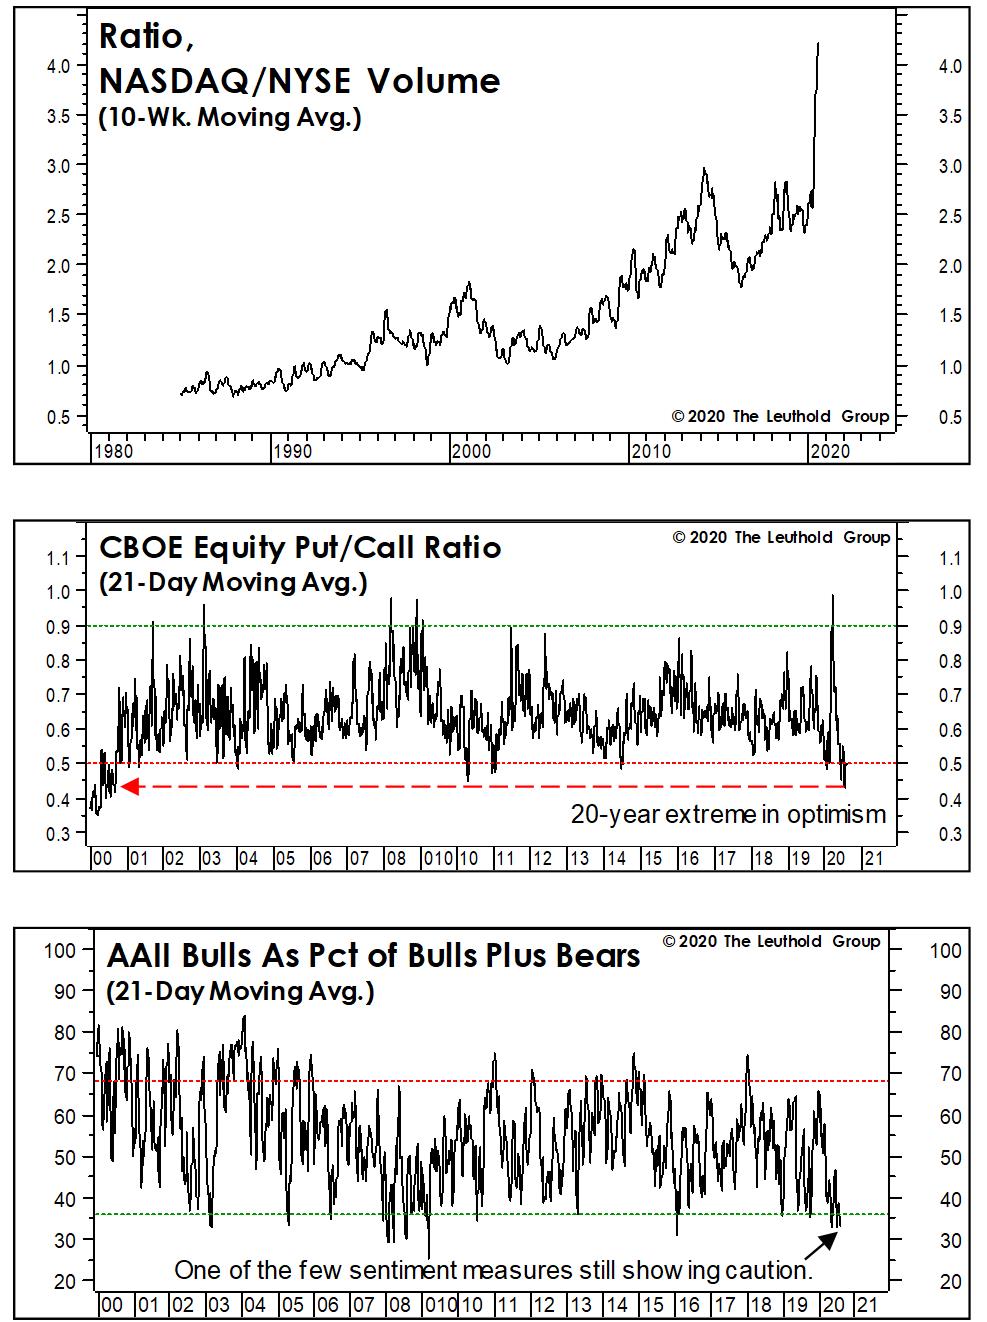
The top chart implies it’s time to lighten up on Tech. The middle chart implies complacency and to get defensive on the general market. The bottom chart implies it’s time to buy.
The only way to reconcile these uncommon conflicting signals is to be selective. Trim what has run excessively and is due for a break (pockets where there is near euphoria), and buy where there is still pessimism, skepticism, reasonable valuation and a durable long-term franchise.
Now onto the shorter term view for the General Market:
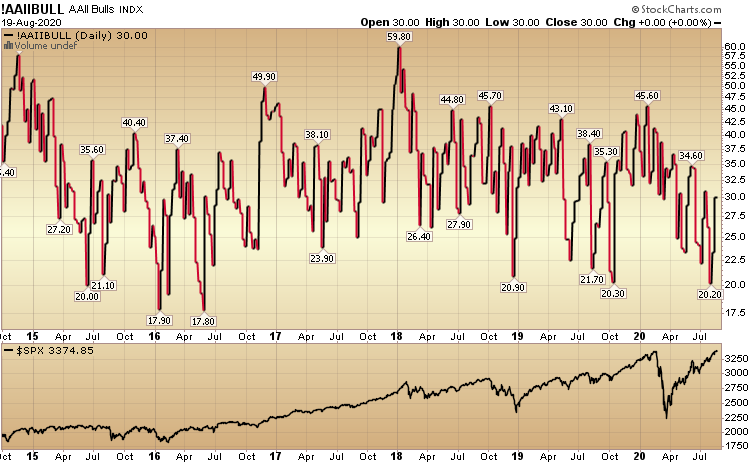
In this week’s AAII Sentiment Survey result, Bullish Percent (Video Explanation) flat-lined to 30.39% from 30.04% last week. Bearish Percent also flat-lined to 42.4% from 42.12% last week.
While a bit of optimism started to finally creep in the past two weeks, we are still nowhere near euphoric levels. By this metric, there is room to climb the “Wall of Worry,” but that could change in coming days/weeks when euphoric levels start to return. We have not seen a “Bullish Percent” read above 40 since February.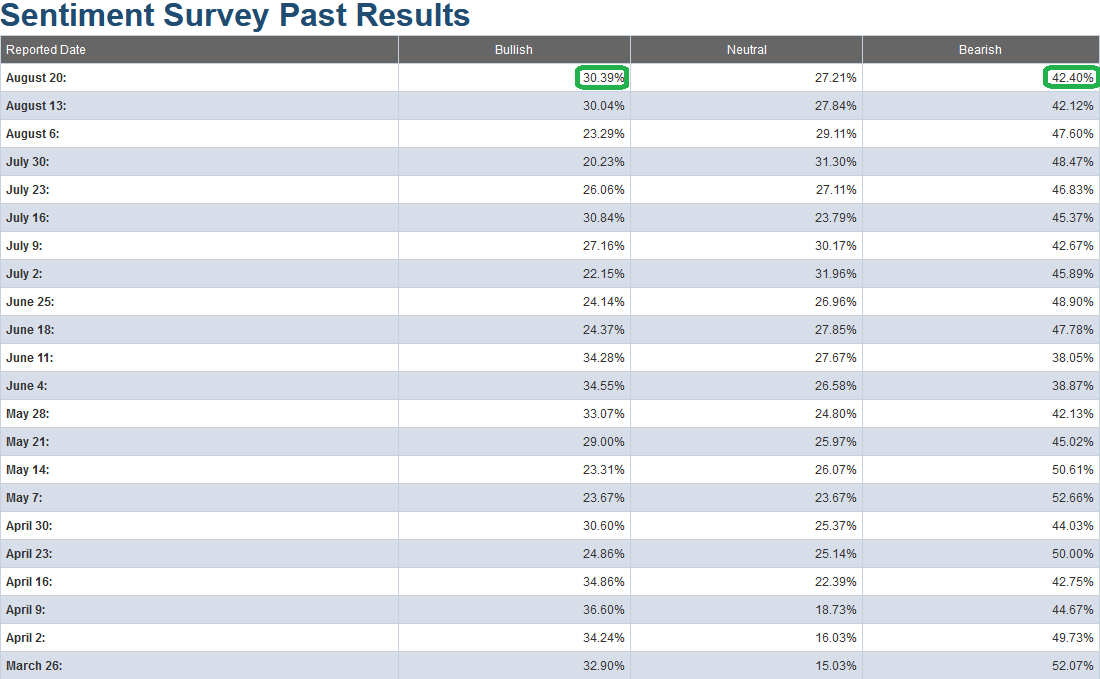
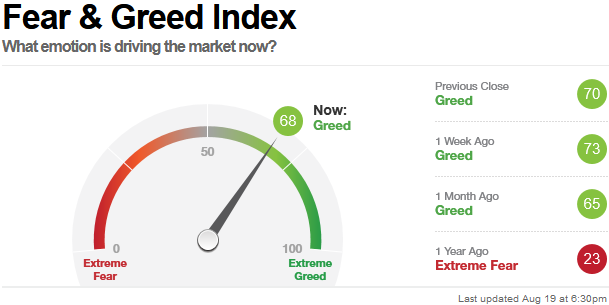
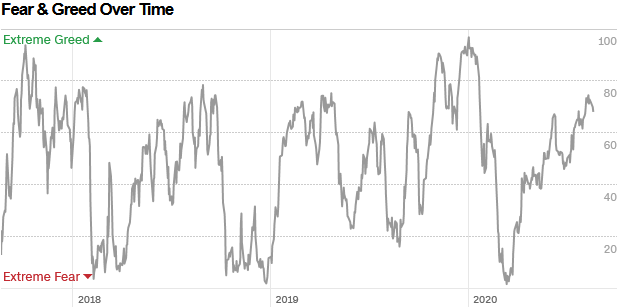
The CNN “Fear and Greed” Index moved down from 74 last week to 68 this week. We have come off NEAR frothy conditions (without reaching them). We have still not hit an extreme/euphoric level (80-100) yet (which is more likely to be hit first, than rolling over from here). You can learn how this indicator is calculated and how it works here: (Video Explanation)
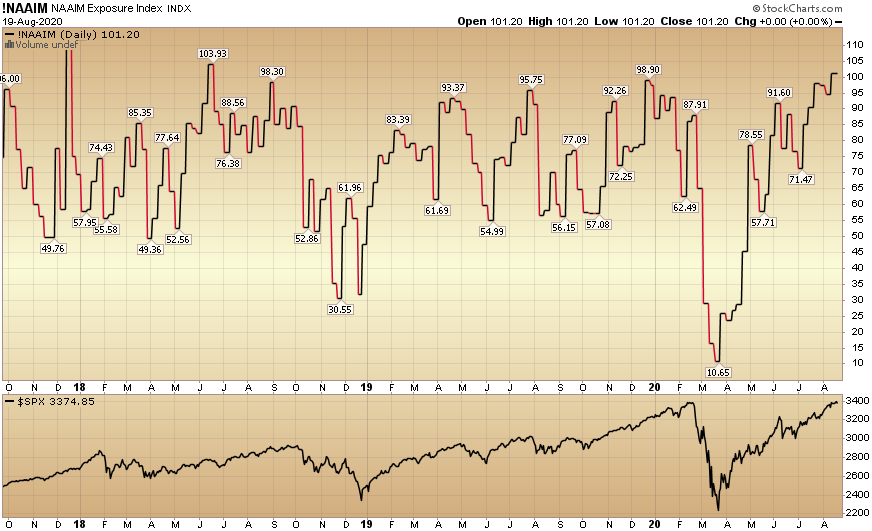
And finally, this week the NAAIM (National Association of Active Investment Managers Index) (Video Explanation) rose from 94.55% equity exposure last week, to 101.20% this week. This is an extreme level, so we must be on alert to potentially trim some huge runners.
Our message for this week:
Signals are mixed. We’ve moved a long way in a short period of time, but while some stocks are “Dancing on the Ceiling” there is another half of the market “Dancing on the Floor” and ready to begin their abrupt upswing. The catalyst will likely come from science at this point. Don’t bet against science.
We remain very constructive in the intermediate term and will take advantage of any additional buying opportunities in laggard/cyclical names – should they arise over the Summer/Fall (on any pullbacks/corrections). I would not be surprised to see a bit of volatility/chop over the next few weeks.
For now, keep on dancing while the music is playing, but keep your feet on the floor…


