

Each week I attempt to pair the lyrics from a popular song to the current feeling and sentiment in the stock market. When you look at the data that has come out on the U.S. economy in recent days, one might suggest you need more than “Beer Goggles” to see the green shoots, you need “Whiskey Glasses!” The salient lyrics from Country Star Morgan Wallen’s 2018 hit, “Whiskey Glasses” that describe today’s economic news are:
I’ma need some whiskey glasses
‘Cause I don’t wanna see the truth
So let’s first lay out the recent bad news, and then work our way to what we may have to look forward to in coming months.
The Bad News:
- FED BEIGE BOOK: MOST DISTRICTS REPORTED DECLINES IN MANUFACTURING, BUT CITED SIGNIFICANT VARIATION ACROSS INDUSTRIES.
- FED BEIGE BOOK: HARDEST-HIT INDUSTRIES WERE LEISURE, HOSPITALITY, AND RETAIL.
- FED BEIGE BOOK: EMPLOYMENT CUTS MOST SEVERE IN RETAIL, LEISURE, AND HOSPITALITY.
- FED BEIGE BOOK: ECONOMIC ACTIVITY CONTRACTED SHARPLY AND ABRUPTLY ACROSS ALL REGIONS IN THE US AS A RESULT OF THE COVID-19 PANDEMIC.
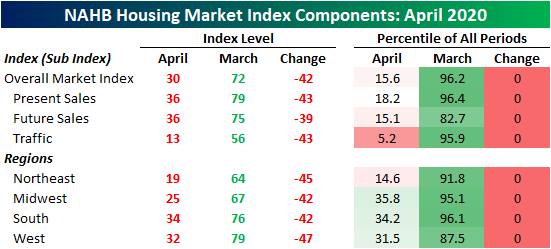
- US NAHB Housing Market Index Actual 30 (Forecast 55, Previous 72)
 (Source: Bespoke)
 - US RETAIL SALES MOM ACTUAL -8.7% (FORECAST -8.0%, PREVIOUS -0.5%)
- US NY Fed Manufacturing Actual -78.20 (Forecast -35.00, Previous -21.50)
- U.S. MARCH INDUSTRIAL OUTPUT -5.4 PCT VS FEB +0.5 PCT
The Good News:
On Tuesday evening I went on CGTV America to talk about the stock market, economy and China’s economic recovery to date:
The key point here is that China has been through what we are going through now. Based on the progress we are now making on the health front (new case curve), we may have some of the following economic progress to look forward to (that they are already seeing in China).
The key theme that I discuss in the segment above is a consistent pattern of numbers coming in less than feared, or “better than expected.” As we get eight weeks past our case curve peak, we may start to see the same (better than expected) theme in our economic numbers – as expectations are rock bottom at this stage.
China Recovery Model:
Export/Import Data from today (better than expected):
- Exports: -6.6% in dollar terms in March YoY. Estimates were -13.9%.
- Imports: -0.9% YoY. Estimates were -9.8%.
“Open for Business”
- Disney partially re-opening Shanghai park.
- Apple re-opened stores. Handset sales up 241% March over February (-23% YoY).
- Yum China opening 95% of restaurants.
- Starbucks re-opened stores. YoY Comps have improved from -90% mid-Feb to -42% last week of March.
Travel:
- TomTom (GPS company): rush hour traffic levels back to 2019 levels (Big Cities).
- OAG (aviation research company): 8m seats in the air for domestic travel (double mid-Feb – 4m). Down from 14.7m seats before pandemic.
Employment:
- Bloomberg: China was 90%-95% back to work at the end of last week, noting pick-ups in the steel market, construction activity and crude processing.
- Chinese exporters recovered over 70% of production capacity as of March 30.
GDP (Friday):
- China’s economy is forecast to have contracted 6% in the first quarter (YoY).
Oil/Demand:
- Rystad Energy estimates:
- <10M bbl/day Feb.
- 12M bbl/day April.
- Target 13.7M (December 2019)
- Increasing Petroleum Stockpiles from 900M barrels to 1.15B (at low prices).
- Refiners: 70% capacity utilization in March (up from 67% in February). Throughput 13M bbl/day in April from 12M March (13.4M last year).
Coal:
- China’s power plants are burning as much coal as they did a year ago.
- LNG demand strong (active buying).
Purchasing Manager’s Index (PMI):
- Purchasing Manager’s Index for March was 52.0
- Analysts consensus PMI was expected to come in at 45
- China PMI was 35.7 in February
China’s Case Curve Peaked On February 5, 2020:

New York (The United States COVID-19 Epicenter) seems to have peaked around April 2:
(Source: Bespoke)
On Wednesday, President Donald Trump said the U.S. has “passed the peak” of the coronavirus outbreak.
“While we must remain vigilant, it is clear that our aggressive strategy is working,” Trump said at a White House news briefing with coronavirus task force on Wednesday. “The battle continues, but the data suggests that nationwide we have passed the peak on new cases.” (Source: CNBC)
We are hopeful that this assessment is accurate. We will know more in coming days and weeks as we watch multiple city/state data.
Discounting Mechanism:
- The Stock Market is a discounting mechanism. Just as it discounted “today’s” bad news by falling 35% peak to trough in Feb/March, it will discount the recovery months before it happens.
- News (economic/deaths) will continue to get worse. Analysts are calling for 15-30% contraction in Q2 GDP and record spike in unemployment over 10%. ($1-2T total hit to GDP)
- This (news) does not necessarily mean the market will get a lot worse (although it may). It all depends on the “Case Curve” progression. Ideally our curve follows China and S. Korea, (not Italy). Epicenter NYC starting to plateau.
- No way to call bottom in the Stock Market, but there is selective opportunity for the prudent investor (with a 1-3 year outlook). Time is your hedge. If you bought in October 2008, you were early. By March 2009 you looked foolish as the market fell another 10-20%. But by June 2009 (less than a year later) you were a genius as the market rallied 43% off the lows.
- Government is filling a $1-2T pothole (economic contraction) with $8-10T of asphalt (aid, stimulus and liquidity).
What to do about it?
On Tuesday, I posted a summary of this month’s Bank of America Global Fund Manager’s Survey. You can find it here:
April Bank of America Global Fund Manager Survey Results (Summary)
The key takeaway was that managers have not had this much cash since March of 2009 – when the S&P 500 hit the low of 666 at the bottom of the Great Financial Crisis. Managers are overweight cash and U.S. Treasuries.
Historically, it has paid to take the other side of the trade when one side of the boat gets this crowded. Managers are currently most underweight Energy, Materials, Industrials and Banks.
In last week’s VideoCast and Article, we discussed whether we thought a retest of the lows was in the cards or not. You can review that analysis here:
HFT VideoCast – Stock Market Commentary and Weekly Recap – Episode 25
Now onto the shorter term view for the General Market:
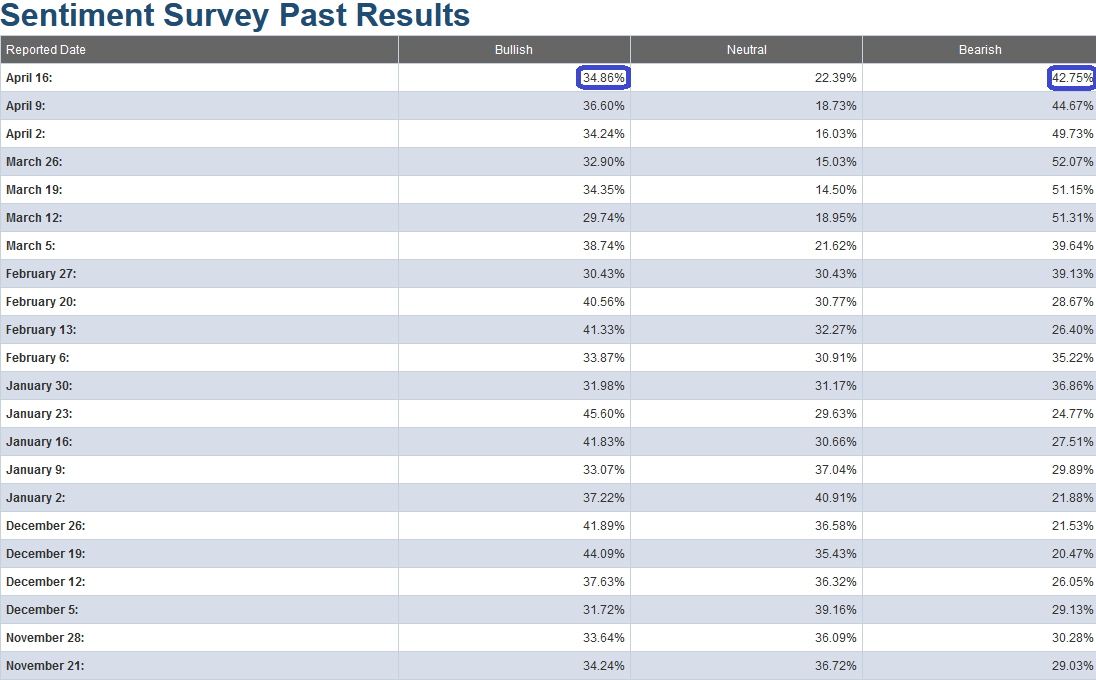
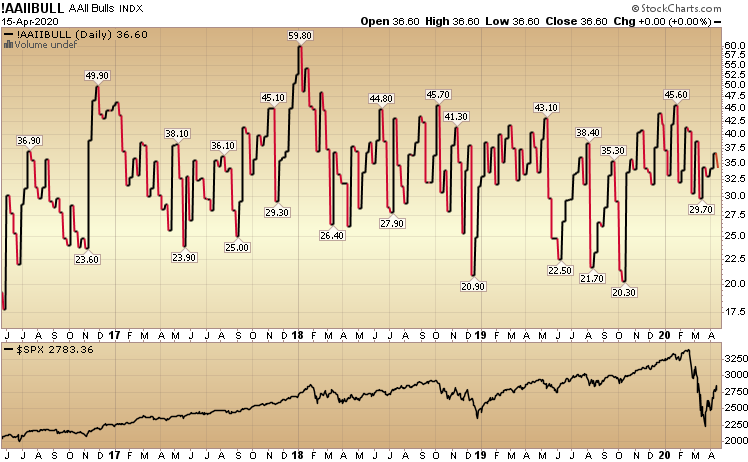
This week’s AAII Sentiment Survey result Bullish Percent (Video Explanation) ticked down to 34.86% from 36.60% last week. Bearish Percent ticked down to 42.75% from 44.67% last week. What is sitting in the back of my mind is the fact that while Bearish Percent is coming off an extreme level, the Bulls never got washed out in the crash.
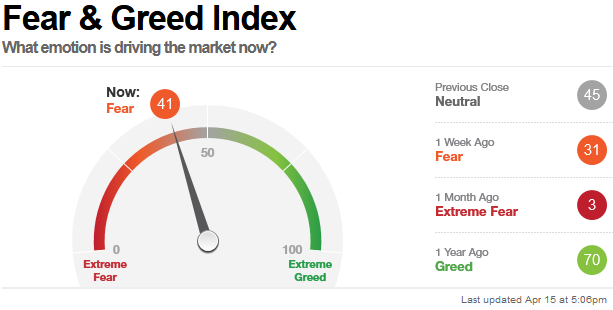
The CNN “Fear and Greed” Index rose from 33 last week to 41 this week. The fear is thawing and will move in fits and starts in coming weeks. You can learn how this indicator is calculated and how it works here: (Video Explanation)
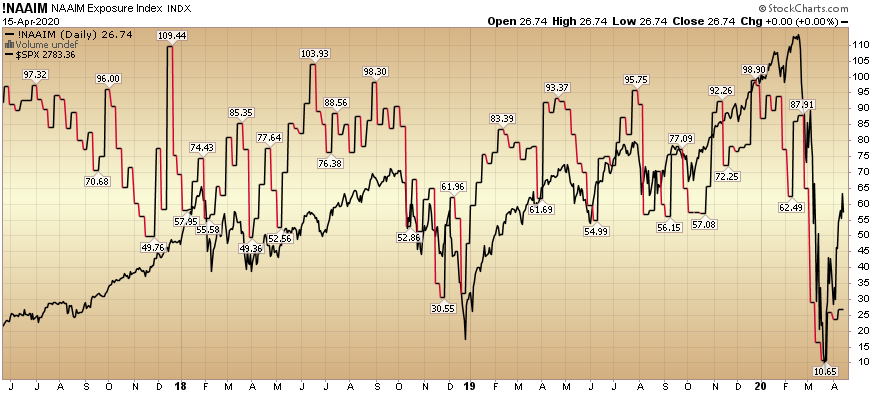
And finally, this week the NAAIM (National Association of Active Investment Managers Index) (Video Explanation Here) rose modestly from 23.67% equity exposure last week, to 26.74% this week.
Active managers will have to regain exposure in coming weeks as the worst of the news starts to move into the rear view mirror. We are not there yet. The worst news is still ahead but it will get better. It always does…
Our message for this week is the same as last week:
Because we have taken advantage of most of the best discounts that were available in equities (prior to last week – see previous weekly notes under “sentiment” category of the site), we shifted focus in the past two weeks to start picking up a selective portfolio of distressed high yield credit – that has fallen materially since the advent of COVID-19 (i.e. some bonds have fallen as much as 40-60% in the past 6 weeks – from par).
There are selective pockets that have not recovered to the same extent as the equity markets have. We believe that many of these securities will recover to par over time as credit markets repair and government provided liquidity finds its way to this distressed corner of the market.
We also have dry powder available to add to equities in the event we do get a re-test (or lower in coming weeks and months), but that appears to be a lower probability at this point. If the facts change, we will adjust, and be ready to take advantage. But for the time being, the bulk of the opportunity is in a selective basket of researched individual distressed credit securities.
As was our repeated plan in the previous four weeks (prior to last week) of buying the highest quality equities on every red/down day (and sitting on our hands on green days), we have followed and will follow the same template in the high yield credit markets.


