

This week I chose Country Legend Tim McGraw’s song, “I Like It, I Love It” to embody the current sentiment of the Stock Market. While anyone who has been around knows – it can change on a dime – right now, market participants are enjoying the ride and singing along:
But I like it, I love it, I want some more of it
I try so hard, I can’t rise above it…
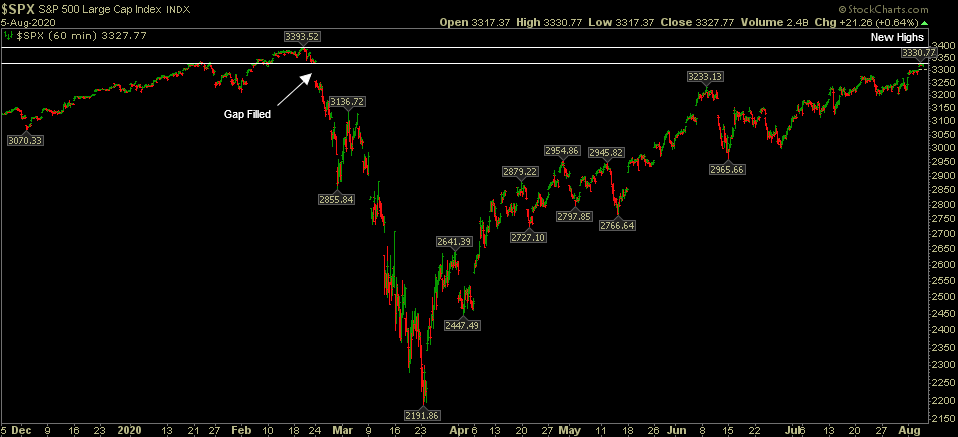
Now that we have filled the “Gap” from late February (that we referenced in recent weeks’ notes), the question is whether the S&P 500 has enough gas in the tank to “rise above it” and make new highs:
Last week, we emphasized the relative performance between leaders and laggards – and that we wanted to make some “Friends in Low Places” – by focusing on those cyclical/value/laggard sectors we believe will outperform in the early stages of the recovery. You can find/review the note here:
The Garth Brooks, “Friends in Low Places” Stock Market (and Sentiment Results)…
Cyclical Rotation?
On Tuesday, I was on Fox Business, “The Claman Countdown” with Liz Claman. 
My appearance was a cell phone “call in” from Connecticut this time – versus a normal video interview – because literally 30 minutes before the show, the cyclone/tornado (Isaias) took out power, phone and cable simultaneously! A generator was of no assistance. Thanks to Liz and Ellie Terrett for having me on.
The question Liz asked was, “with the huge run in Tech, if you had to rotate to another sector now, what would it be?”
I said, I would follow Warren Buffett into banks. In the past couple of weeks he has purchased $2B of Bank of America stock – now taking his position to ~$25B. Wells Fargo is also one of his top holdings.
It is these times – when articles are asking whether Warren has “lost his touch” because he’s buying laggard, cheap, value stocks instead of “high-flyers” – that precede his periods of biggest out-performance. Last week, we looked at/linked to recent (year 2020) AND older (year 2000) articles that questioned Warren Buffett. Spoiler Alert: They are always wrong in the long-term.
I also elaborated on the fact that – since Wells Fargo has now cleaned house (Management) and changed its policies/practices – Bank Regulators may be in a position to lift the $1.95T asset cap. The “asset cap” was imposed on Wells Fargo in February 2018 as punishment for its aggressive sales tactics. Furthermore, it is paramount to lift the “cap” if the government is committed to seeing a strong, sustainable recovery.
Well Fargo is one of the largest mortgage and small business “Main Street” lenders in the country. They act as a “transmission mechanism” for credit growth and expansion – which is essential for a sustainable recovery. With 100% of former leadership now replaced (as of a couple of weeks ago), management can go back the their regulator and ask for relief.
Lifting the “asset cap” on Wells Fargo is among the most important steps this Administration can take to secure a strong economic recovery and put millions of people back to work. It can also be one of the catalysts for the stock to trade back up to book value and beyond. Wells currently trades at a ~35% discount to book – relative to the 75% premium to book it traded at just a few years ago. In other words, it is at an extreme…
Financials are expected to grow earnings by +31.6% next year – relative to the overall market +29.2% and Tech at just +14.3%.
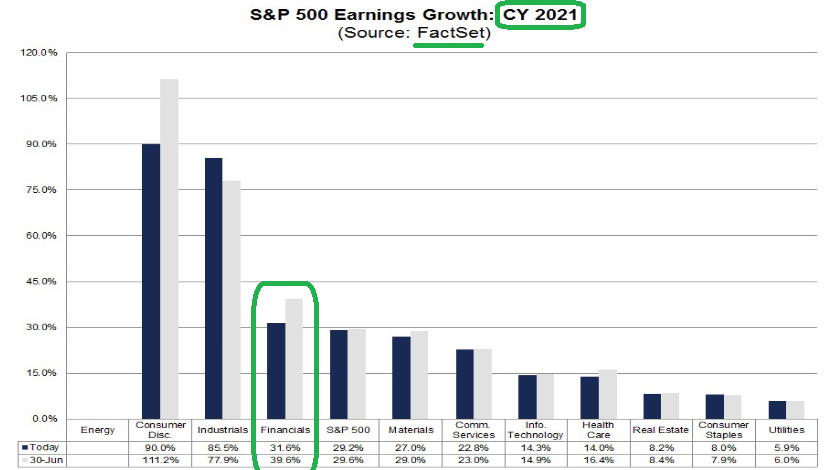 This supports the thesis that laggards begin to outperform moving forward.
With regard to Liz’s question, we also like Defense Stocks, some Energy and Homebuilders (which have already run but will continue to perform in coming years).
Liz also referenced a Morgan Stanley note (by Mike Wilson) that was not only calling for a rotation into cyclicals, but a 10% correction before resuming the V-Shaped recovery. This is plausible, but whether the market corrects a full 10% (as they predict) or not, is dependent upon how aggressively “Value/Cyclicals” pick up the leadership role as we get better COVID/Vaccine/Treatment data in coming weeks and months. When the health recovery is in sight, these laggard/cyclical/value stocks will take off.
US Dollar Weakness
Yesterday, Bloomberg’s Moxy Ying reached out to me for a quote on the weakening dollar. Her questions are in bold:
– How big/important are currency plays becoming when you’re investing in equities? How does weakening U.S. dollar affecting your investment?
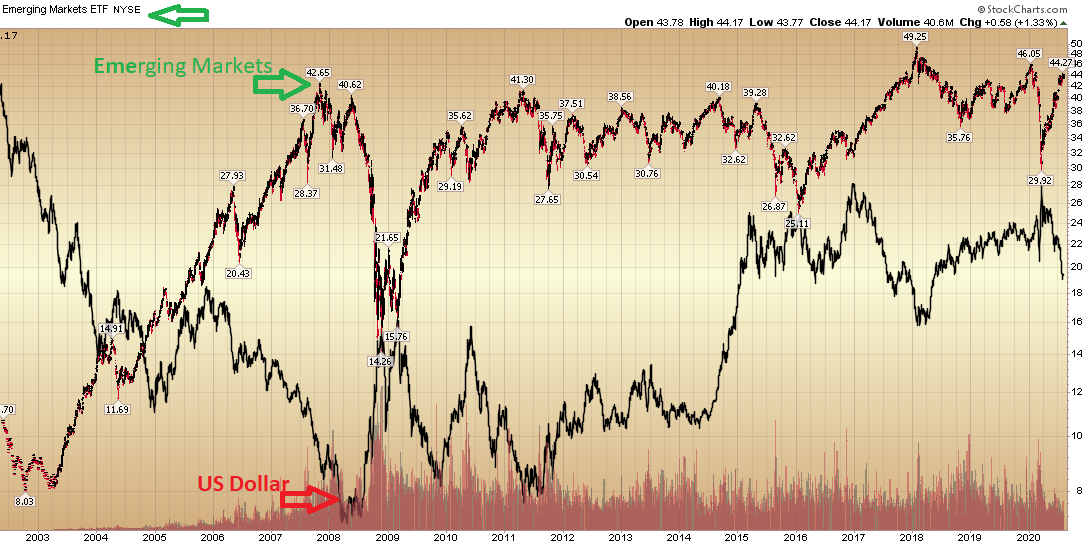
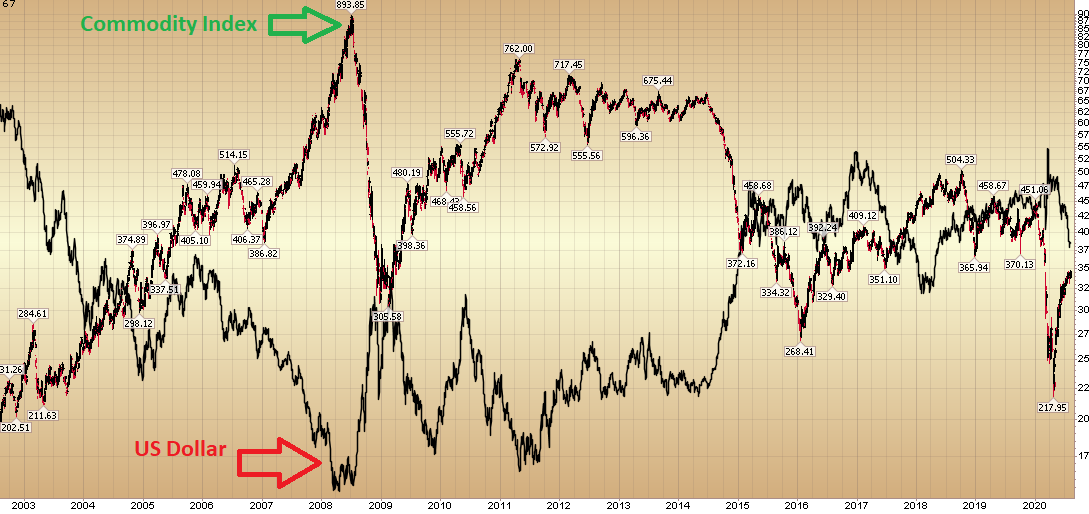
A weakening dollar environment is favorable for emerging markets equities/commodities. It attracts foreign investment and makes it easier for emerging market companies to service USD Denominated Debt.
– How does a weaker USD affect company fundamentals? What kind of companies/sectors/regions are most benefit from a weaker USD? What companies are most vulnerable?
It is estimated that mid-40% (42.5-47.5%) of revenues for the S&P 500 come from overseas (depending on the year). A weakening dollar helps S&P earnings as the foreign currency received converts back to more USD and improves EPS. It also makes US exporters more competitive in foreign markets. A weak dollar is a tailwind to US earnings and a headwind to the US Consumer – who loses some measure of purchasing power (particularly with regard to imports and commodities – which are denominated in USD).
Tech is a big beneficiary of a weaker USD as ~60% of revenues for the sector come from abroad.
Industrials also have a higher than average weighting of overseas sales and benefit from a falling dollar. It makes them more competitive globally.
Consumer Staples benefit less from a weak USD as inflation hurts input costs. Materials and Energy stocks benefit from a weaker dollar as commodity prices tend to rise.
Financials generally benefit from a weaker dollar as yields tend to rise – helping net interest margin for banks.
Healthcare, Utilities, Real Estate and Telecom have significant sales in US so are less effected by a weakening dollar.
– Are currencies becoming a key/increasingly important determinant of what stox you buy, and why? What’s your thinking and philosophy behind this?
A weakening dollar makes me want to have more Emerging Markets Equity and Commodities exposure. Here’s why (Emerging Markets line is in red/black, US dollar is in solid black):
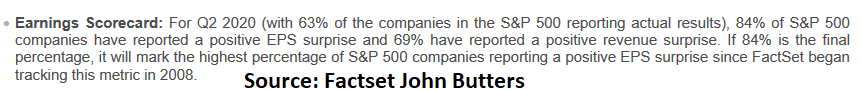
- Earnings and Estimates Exceeding Expectations:
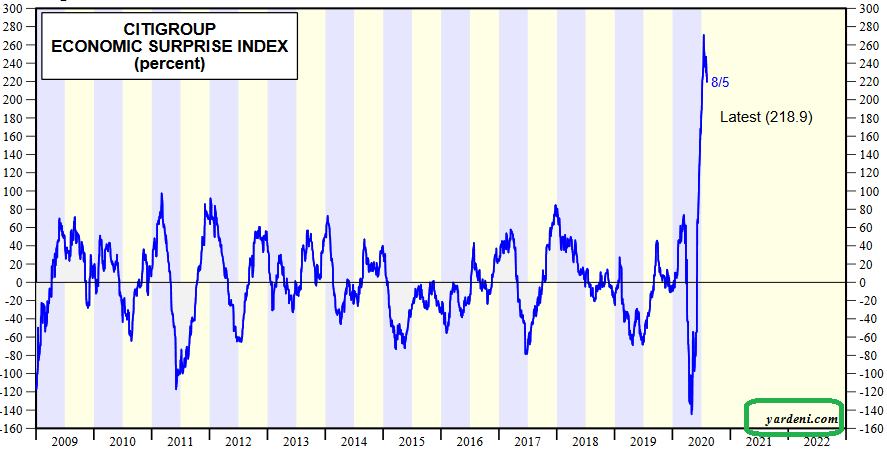
- Economic Data continues to beat expectations:
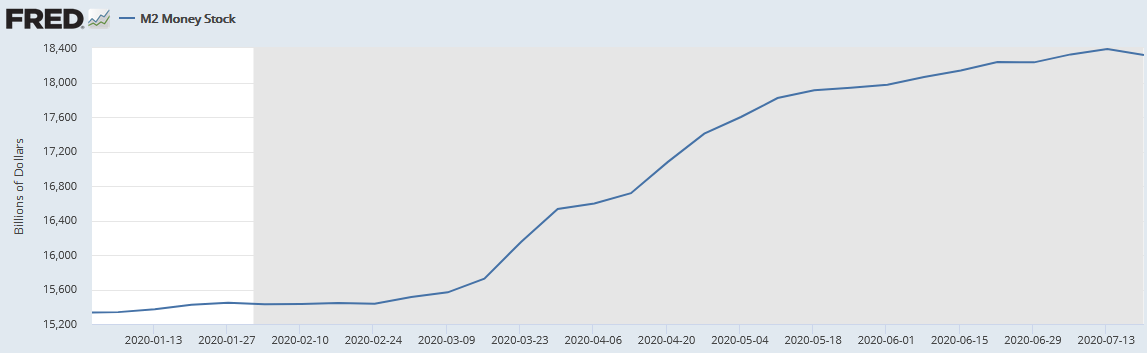
- Economic Stimulus, Aid, Liquidity and Money Supply (M2) continues to exceed the short term contraction in growth by a factor of ~10 [~$1.2T estimated GDP contraction in 2020 compared to >$10T in authorized (largely unused) Stimulus, Aid and Liquidity].
- Daily “Good News” coming out with regard to Vaccine/Treatment Progress: Pfizer, JNJ, Novavax, Moderna, Eli Lily, Gilead, Regeneron, Oxford/AstraZeneca, Inovio, etc.
- New Covid Cases Slowly coming down:
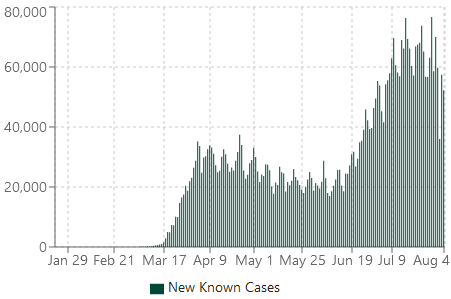 Source: usafacts.org
Now onto the shorter term view for the General Market:
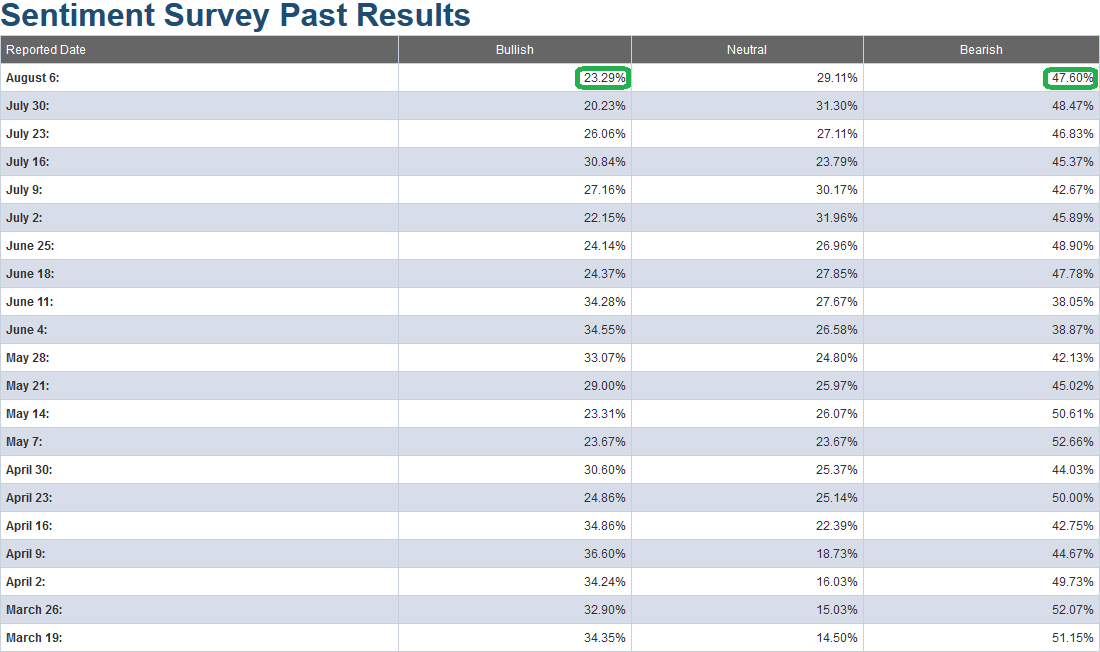
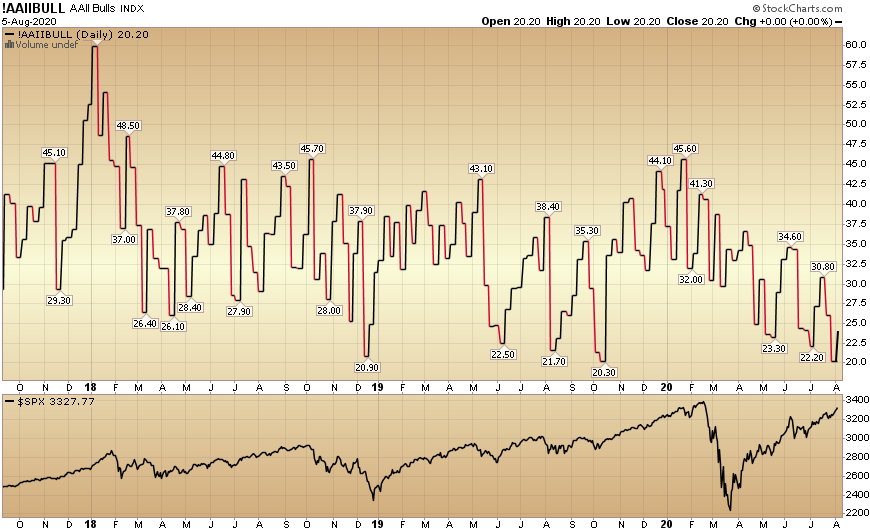
In this week’s AAII Sentiment Survey result, Bullish Percent (Video Explanation) rose to 23.29% from 20.23% last week. Bearish Percent trimmed to 47.60% from 48.47% last week. These are still extreme fear/skepticism levels that historically favor being a buyer versus a seller.
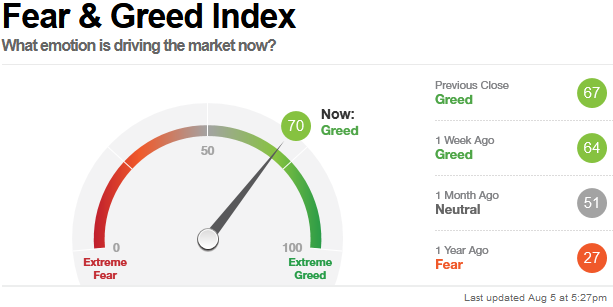
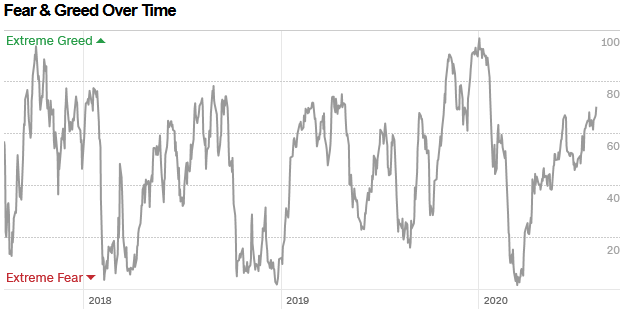
The CNN “Fear and Greed” Index moved up from 65 last week to 70 this week. While we are now getting closer to frothy conditions, we have still not hit an extreme/euphoric level (>80/90) yet. You can learn how this indicator is calculated and how it works here: (Video Explanation)
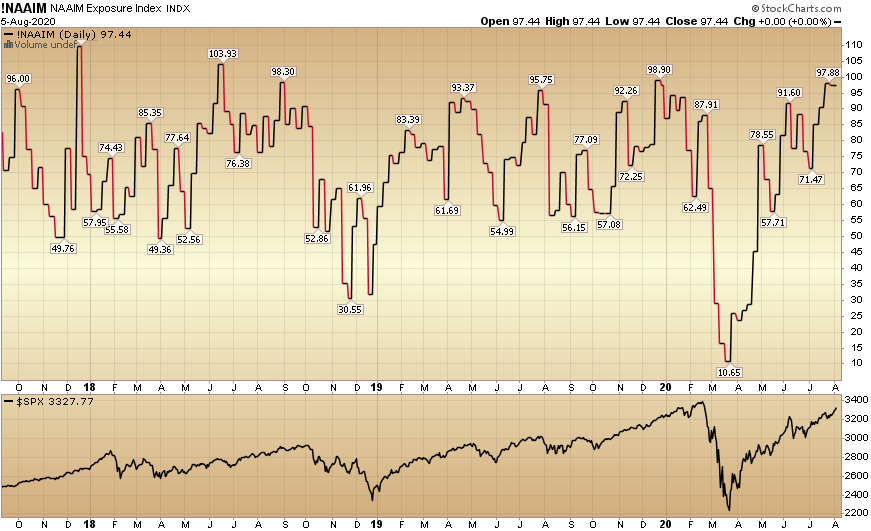
And finally, this week the NAAIM (National Association of Active Investment Managers Index) (Video Explanation) flat-lined from 97.88% equity exposure last week, to 97.44% this week. This is an extreme level, so we must keep an eye on it now.
Our message for this week:
I don’t think I’ve ever seen such a divergence between active managers (NAAIM) being “all in” and individual investors being scared out of their minds (AAII). Because of that – I’m using the CNN Fear & Greed as a tie-breaker for now – and it still shows modest room to run until hitting “euphoric” levels.
We remain very constructive in the intermediate term and will take advantage of any additional buying opportunities in laggard/cyclical names (per discussion above) – should they arise over the Summer/Fall (on any pullbacks/corrections). I would not be surprised to see a bit of volatility/chop over the next few week(s).
But for now, it’s time to “Like It and Love It” until euphoria shows up – uniformly across all metrics – and it becomes time to trim some winners.


