

James Branch Cabell, “The optimist claims we live in the best of all possible worlds, and the pessimist fears this is true.”
In many of his campaign rallies, President Trump said, “you’re going to start winning so much that you’re going to beg that I can’t take it anymore!”
Well that was quite a tall order, but regardless of what side of the political spectrum you lie on, Wednesday’s “Phase 1” deal was a big win for the U.S., for China, and the rest of the world.
While we covered many of the the deal details in December, and on a few media appearances I emphasized that Phase 1 was “better than expected,” yesterday the long awaited deal became a reality.
Here’s what we got in Phase 1:
1. China’s additional purchases of U.S. goods (over 2017 high watermark) will total $205 billion to $210 billion over two years. Chinese sources indicate the buys could be as high as $215 billion – $220 billion.
2. This is an enforceable agreement secured by the tariffs remaining in place on $375B of Chinese goods until Phase 2 is completed.
3. $50 billion of crop purchases.
4. $50 billion in energy purchases (this is new and very interesting to see how it will impact the S&P Energy sector earnings power in coming months). Of note, there were more energy CEO’s at the signing than Chinese people. This tells me that guidance may start to come up for this group in coming weeks and months.
5. $75 billion to $80 billion worth of manufacturing.
6. Beijing has agreed to stop the theft of intellectual property.
1/2% increase to GDP?
When Director of the United States National Economic Council, Larry Kudlow said that he expected this deal to add 1/2% to GDP, many were skeptical. Now that the numbers are in, it looks realistic (if not conservative). This will offset the up to 1/2% loss in GDP from Boeing in 2020 (and it’s possible we could see Boeing pull together faster than expected now that they have new leadership in place).
More PINNING:
For several weeks now we have acknowledged that the short term indicators were a bit stretched but also warned that due to positioning (and other factors), we would not be surprised to see them stay PINNED for a while like they did from 2013-2015 and 2016-2018. To see the charts and understand what pinning is and why it happens, read this article:
The Katy Perry “Hot ‘N Cold” Stock Market (and Sentiment Results)
When will this non-stop rally end?
On September 5, 2019 we called for a melt-up (for equities) into year-end when massive money was flowing into bonds. Despite all of the skepticism, we got it in spades – to the tune of a 16.55% rally off the August lows in the S&P 500 and a 20.82% rally in the Nasdaq.
The overriding pessimism at the time was predicated on the 2/10 yield curve inversion – which had occurred early in the month of August – AND the fact that we were entering our third consecutive quarter of Negative earnings growth.
I made the case that the average stock market appreciation AFTER a yield curve inversion – in the most recent few instances – was mid-30’s% and the average time until the market peak was ~18 months after inversion. You can review the history here:
The Lil Nas X – “Old Town Road” Stock Market (and Sentiment Results)
Furthermore we made the case that the last time we had 3 consecutive quarters of negative earnings growth was 2016, and that coming out of the period from Q4 2016 to Q1 2018, the S&P 500 rallied over 37% – discounting double digit earnings growth in 2017. We are now coming out of 3 quarters of negative earnings growth and the market has started to discount the close to double digit earnings growth for 2020.
Late Cycle or Mid-Cycle?
Consensus is that we are late/end of cycle. But that has been the case since 2016…
When we do get a 10% pullback at some point this year, many will claim victory for “calling it” but forget to mention the other 57% of upside that preceded the “crash” since late 2016.
So the good news is – if you are in the “late cycle” camp – that it would not be unreasonable to expect a mid-30% gain from the inversion, and a mid-30% gain due to earnings. The bad news is, we have already consumed about 16.5% of that potential gain and have ~20% left on the S&P 500.
I am not convinced this is “end of cycle” yet (I am keeping an open mind to this being “mid-cycle” ~1995). Here’s what I would need to see to confirm a longer term (mid-cycle) run:
1. Discount Rate: Fed follows through on no raises until 2021 and lets the economy run a bit hot like they did in 1995. Chair Powell acknowledged that they raised too fast in 1998 (just 7 months after the 3 cuts), which cut the cycle short causing a final peak in March 2000. He is committed to increasing the labor force participation rate and the only way to force another 2-4 million people back into the workforce is to let wages run a bit hot.
2. Liquidity: The Fed maintains liquidity and unwinds $785B of quantitative tightening that they executed from 2017-2018. So far they have restored over $400B of liquidity since August 2019. On Tuesday of this week, they committed to continue liquidity operations until mid-February and then taper down.
IF they follow through on that commitment (to taper down prior to achieving a full unwind of QT), I would expect to see some choppiness or at least sideways consolidation in the month of February or March as the market discounts any reduction of the liquidity commitment.
Fed will continue repo offerings into February, reducing term operations
3. Stable to Increased Earnings Guidance: Now that there is clarity on trade (Phase 1), we need to see CEO and CFO sentiment start to thaw and slowly start to increase investment/take earnings guidance up. As we pointed out on December 26, CEO and CFO sentiment got down to 2009 levels in December (before the phase 1 deal was announced). 2009 was a bottom, not a top, same as 2001. You can see the data here:
The “Fly Me to the Moon” Stock Market (and Sentiment Results)
4. Some sector rotation. In order for this performance to persist, we will need to see some sector rotation under the surface and discontinue reliance on a handful of stocks. We know this is possible as AMZN, NFLX, and FB took a back seat during certain periods in 2018-2019 while MSFT and AAPL stepped in to pick up the slack.
We will look to see if new sectors can start to contribute and make it a more sustainable rally. Right now, the worst 3 sectors of 2019 are projected to have the highest earnings growth rates of 2020 (Energy at 21.8% EPS growth, followed by Industrials and Materials).
This rotation does not have to come at the expense of Tech, but rather as a supplement to start to carry their own water in 2020. You can review our thesis on Exploration and Production (Energy Sub-sector) here:
The J. Paul Getty (Energy) Stock Market (and Sentiment Results)
5. Multiple Expansion: If the previous 4 items manifest, the natural byproduct will be multiple expansion. Lower discount rate + earnings growth = multiple expansion. Although we are currently trading at 18.5x forward, a late cycle forward multiple (with the current discount rate) could hit a level in the low 20’s before the cycle ends. BUT, the earnings guidance needs to present itself in coming weeks or it won’t happen.
6. BOEING RECOVERS QUICKER THAN EXPECTED: The BIGGEST contributor/detractor to 2020 will be BOEING. In the past 60 days, BA EPS estimates for 2020 have come down from $21.13 per share to $16.01. That means that if not for BOEING, 2020 EPS for the S&P 500 would be $182.76 versus $177.64 (as of Friday).
If BA recovers quicker than expected (which President Trump alluded to at his press conference yesterday), it takes the forward multiple down to 17.86x versus 18.5x. IT ALSO INCREASES THE 2020 EPS GROWTH RATE FROM 9.5% to 12.38%. That would be enormous and potentially contribute to a multiple expansion up to 20x (which would put the S&P 500 over 3650 at some point later in the year – yielding >13.5% return in 2020.
The opposite is also true:
If two or more of the factors identified above fail to materialize and forward guidance comes down – we could see multiple contraction and all bets are off. While this is a lower probability scenario, it is still possible, which is why we watch the data very closely (company by company) as it comes in.
An Important Note on Bank Earnings:
In aggregate, bank earnings were better than expected – buoyed by a strong consumer AND massive trading profits. Citigroup’s trading revenues were up 28% from a year ago, JP Morgan’s trading revenues were up 56% and Goldman Sachs’ bond trading revenue jumped 63%! Bank of America was not far behind with a 25% surge in bond trading revenue year on year.
WAIT? Trading Profits? I thought Dodd Frank put an end to that…
Not so fast my friend. One of President Trump’s pillars of economic growth was deregulation. Banks made a lion’s share of their profits from trading pre-crisis. The “Volcker Rule” cracked down on prop trading (and while the line was blurry between market making and speculative trades restricted by the new regulation – it was apparent that prop trading had ground to a halt post-crisis – as evidenced by their anemic earnings power).
But that has all changed now…
Last August, the FDIC and OCC approved a rule to amend and simplify the compliance requirements of the Volcker Rule, a centerpiece of the Dodd-Frank Wall Street Reform and Consumer Protection Act.
You can read the rule change below, but the basic summary is that big banks are now presumed to be in compliance versus having the prove on a daily basis that they are in compliance.
Volcker Rule Changes – August 2019
If you don’t understand what that means, just look at the trading results above (before the change and after the change) and you will understand the impact.
With the pre-crisis weighting of financials at 22% of the S&P 500 and the current weighting at 13% – there is a ton of room to make up lost ground in coming years as the shackles come off and earnings can grow once again. The opening of the Chinese markets to US financial services yesterday won’t hurt either…
Now onto the shorter term view:
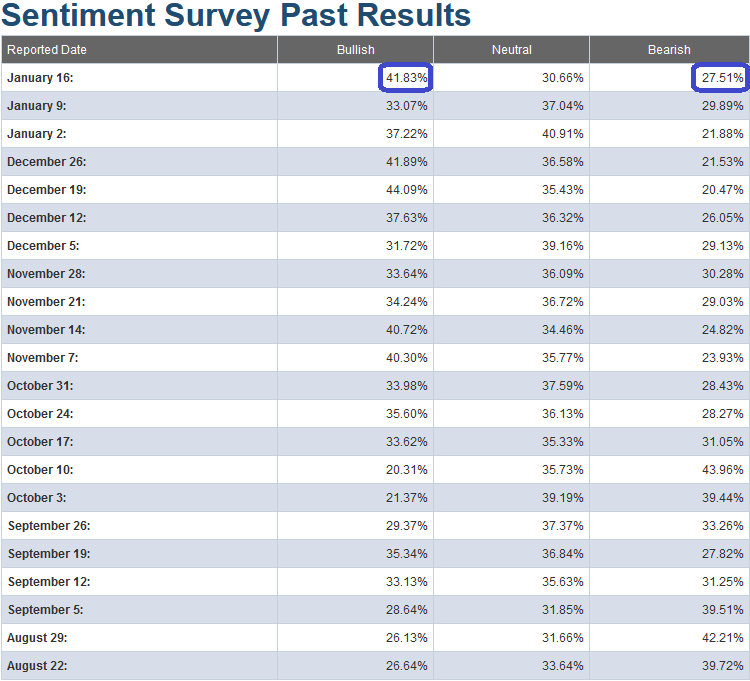
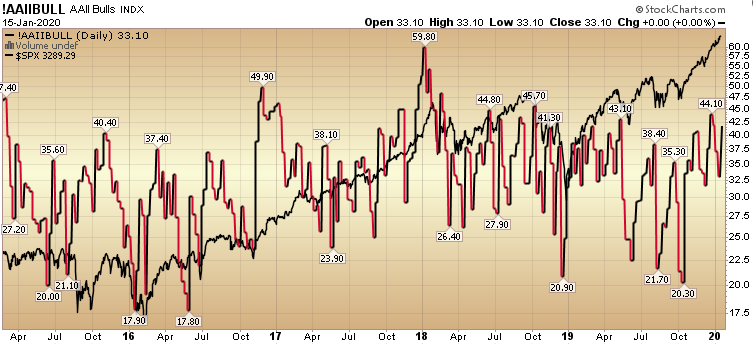
This week’s AAII Sentiment Survey result (Video Explanation) Bullish Percent came in at 41.83%, UP from 33.07% last week. Bearish Percent fell to 27.51% from 29.89% last week.
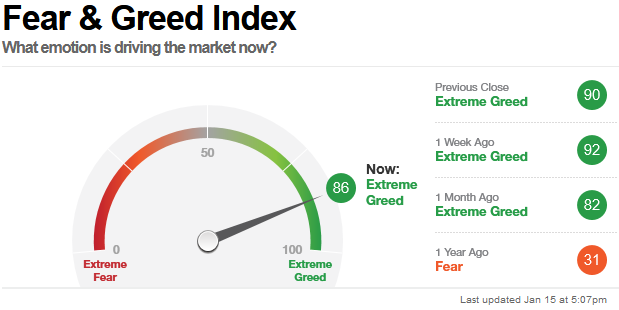
The CNN “Fear and Greed” Index – which fell 6 points (from 92 last week to 86 this week) did not confirm the increase in the AAII Sentiment Survey. However, it is still at an extreme level.
This is generally not the place you want to be adding a lot of NEW exposure unless it is in stocks/sectors that have not yet participated in the rally and have solid fundamentals. You can learn how this indicator is calculated and how it works here: (Video Explanation)
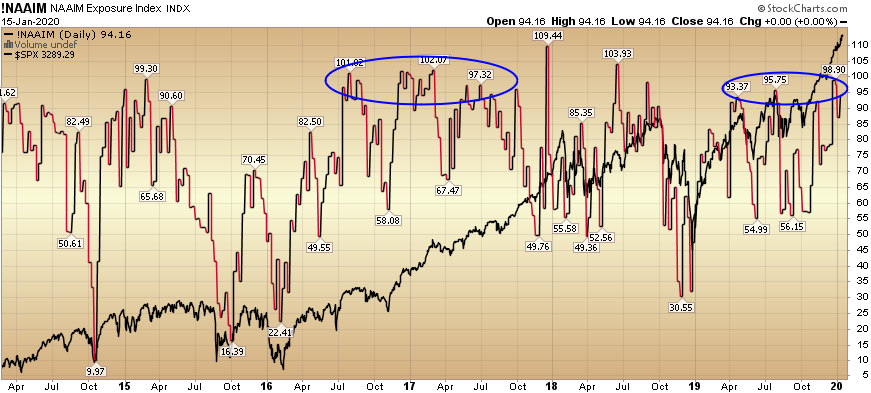
And finally, this week the NAAIM (National Association of Active Investment Managers Index) (Video Explanation Here) rose from 86.99% equity exposure last week, to 94.16% this week. While this is still an elevated level, these levels can stay “pinned” for some time when they are emerging from a significant trough (like early 2016 and late 2018). For a more detailed explanation of “pinning” review “Katy Perry” article above.
Our message for this week is similar to last couple of weeks:
We remain bullish in the intermediate term (for 2020). As we have stated in our recent notes, we have trimmed some names that have had huge runs off of the August/September lows, and had re-allocated some profits into sectors/stocks that had just begun to participate.
We also recently added a few selective shorts. The short positions are not due to bearishness per se, but rather “special situations” that we believe will work even in a sideways to up market and outperform in the event of a pullback.
You can review our previous notes under the category “Sentiment” on the right side of the site.


