

This week we are going to discuss the Stock Market in the context of Lil Nas X’s Billboard #1 hit – “Old Town Road.” In the ever popular lyrics he makes the case:
“Yeah, I’m gonna take my horse to the old town road
I’m gonna ride ’til I can’t no more
I’m gonna take my horse to the old town road
I’m gonna ride ’til I can’t no more”
Listen to Lil Nas (ft. Billy Ray Cyrus) here
The concept here is that while short term indicators are “overbought” and can be worked off in either price OR time (short term pullback OR move sideways for a few days/week), the intermediate term move is still higher. Ignore any short term bumps and keep riding until the data insists that you get off of your horse.
To navigate the short term “bumps in the road” we covered a key concept last week called “PINNING” – which happened in Q4 2016 and Q4 2017 – where the market continued to rise despite short term “overbought” conditions. You can review the explanation here:
The Katy Perry “Hot ‘N Cold” Stock Market (and Sentiment Results)
Following Lil Nas X’s suggestion is a sensible way to look at today’s market for the following reasons – (the “old town road” may be longer than you think):
- Institutions (and individuals) got too bearish when the yield curve inverted in August and now are playing “catch-up” into year-end to meet their benchmarks. The key takeaway from our note on the BAML Fund Manager Survey this Tuesday was that in 4 of the 5 previous instances when Fund Managers’ cash levels dropped from >5.25% to <4.25% in 30 days, it was near the BEGINNING beginning of a rally, not the end. The second takeaway was that the last time fund managers got this bearish on the dollar, it depreciated by 11.3% over the next 8 months. If history is any prologue, that would be an additional boon to 2020 S&P 500 earnings.
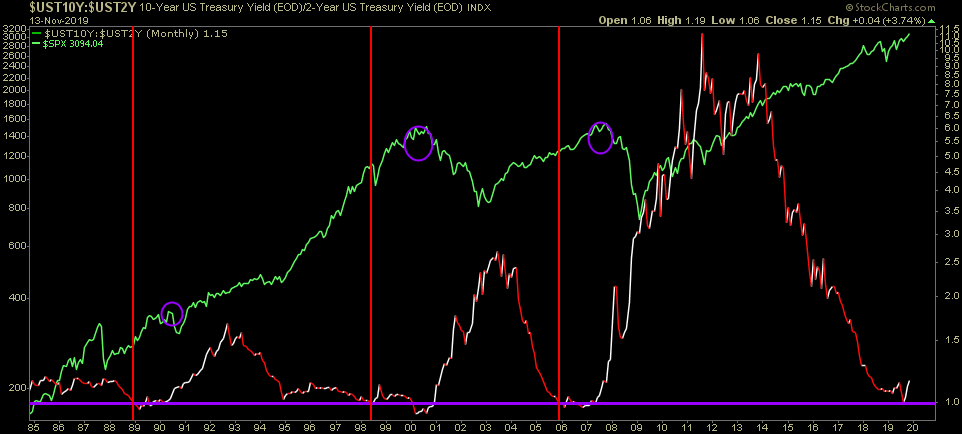
2. The last 3 instances of a 2/10 yield curve inversion (red vertical line), AFTER the inversion the market rallied for approximately 1.5 years and each gain exceeded 30% from the point of inversion to the market peak (purple circle).
3. 2020 earnings estimates continue to hold strong (near double digit growth) for BOTH the US (S&P 500) and Europe (Stoxx 600).
4. The richest 3 people in the world are back in the game (Powell, Lagarde, Kuroda). Chair Powell has given the market the 75bps of cuts it needed, and additionally increased the balance sheet by $280 Billion in the past 11 weeks. The ECB initiated $20B/month in asset purchases on November 1, and the BoJ never left the game.
5. Multiple expansion is likely: With the discount rate lowered by 75bps – and earnings growth returning for the first time since 2016-2017 – it is well within the realm of possibility to see a multiple expansion that could hit later cycle norms of 19-21x in the coming 12 months.
6. 10 year+ expansions are normal, not exceptional (over 100 years of history):
7. Impeachment hearings are just another brick in the “wall of worry” to climb in coming months. The market rallied >50% in the 18 months following the initiation of the Clinton Impeachment hearings in October 1998. There is low probability of impeachment in the House and even lower/no probability of impeachment in the Senate. Unlike Nixon who had a deteriorating economy, oil price shock, and “smoking gun” to contend with, the current scenario is more analogous to the Clinton saga/market conditions than what preceded that period.
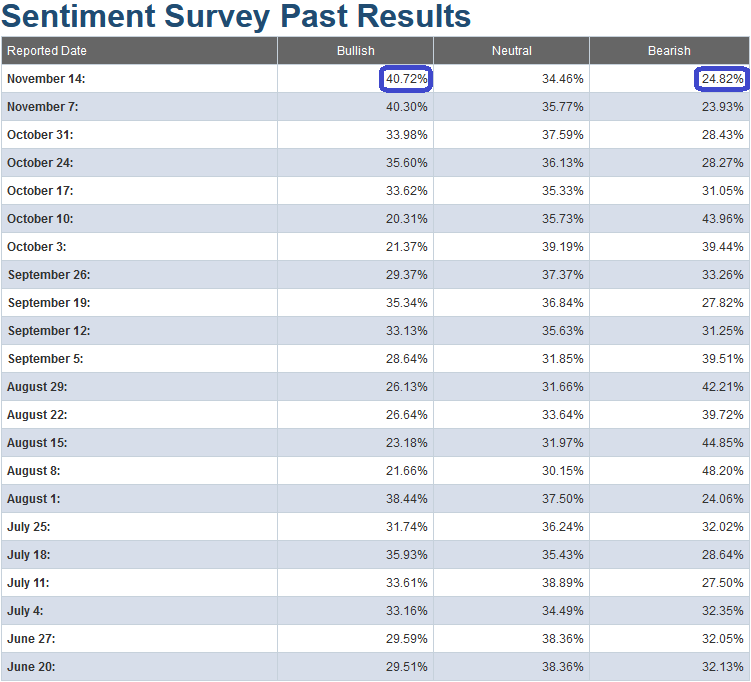
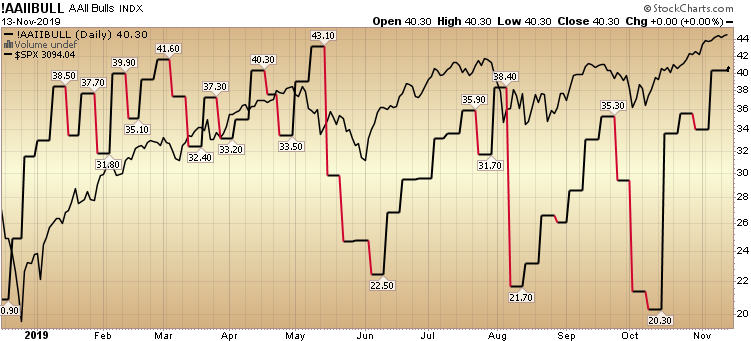
This week’s AAII Sentiment Survey result (Video Explanation) came in at 40.72%, up from 40.30% last week. Bearish Percent lifted to 24.82% from 23.93% last week. Market participants stayed bullish over the past week.
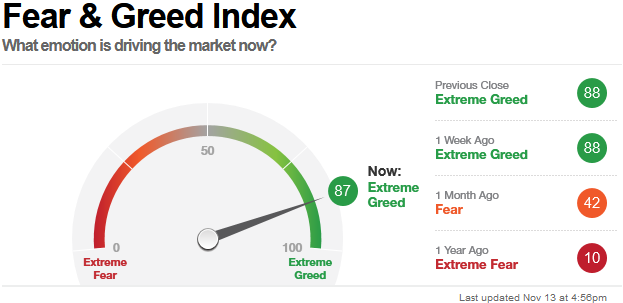
This was confirmed by the CNN “Fear and Greed” Index – which stayed “PINNED” overbought at 87 (down a point from 88 last week).
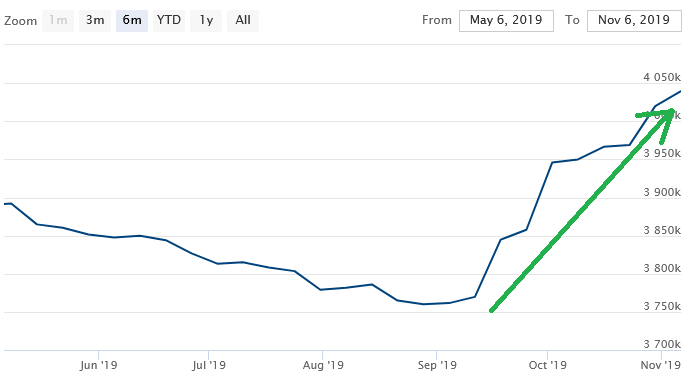
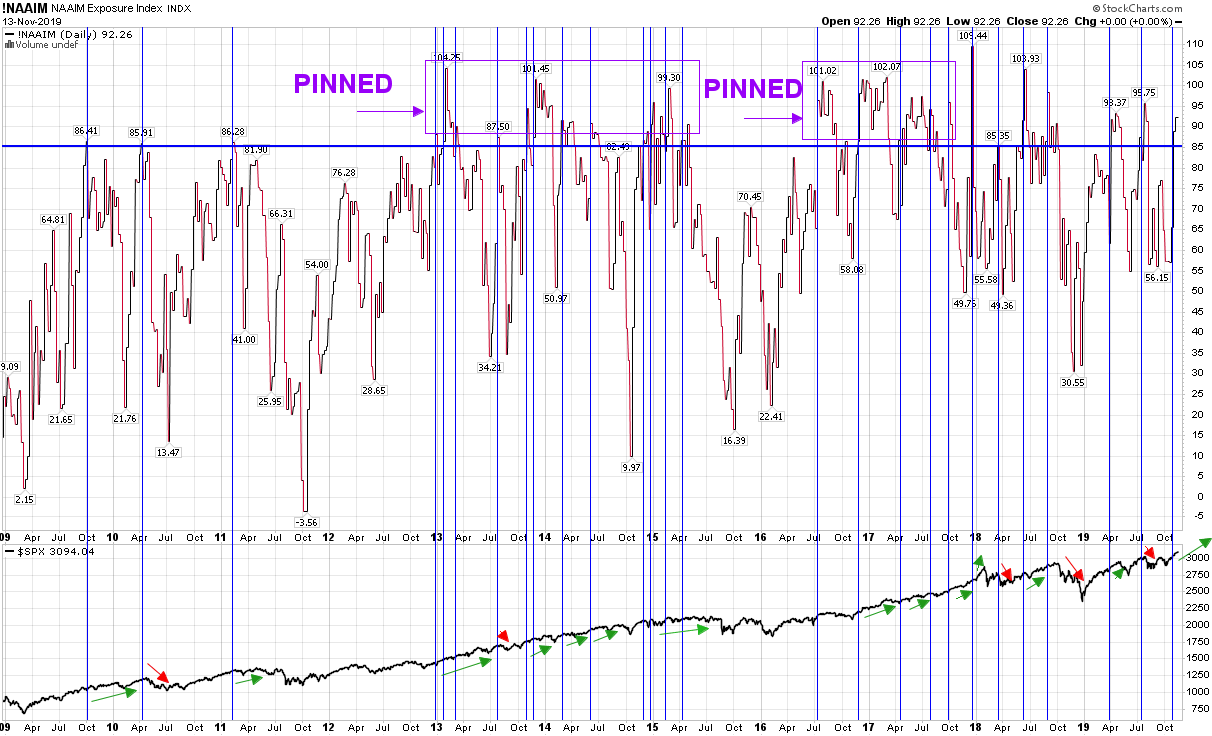
Here’s another example of indicators getting pinned. This week the NAAIM (National Association of Active Investment Managers Index) moved up from 88.94% Equity exposure to 92.26%. If we look at a shorter term chart we would say, okay everyone is in now, time to go short. But when you zoom out and look at a longer term perspective you can see that it can get pinned above 85-100% for months or years at a time (2013-2015 and 2016-2018).
So while the short term indicators point to a “stretched” position again this week, it is possible that they can stay stretched – as was the case in Q4 2016 (in anticipation of double digit earnings growth in 2017) and Q4 2017. This condition can also get worked off by a mini-shakeout for the late money that only joined the party recently, or just grinding sideways for a bit before a resumption higher.
As we have said for the past couple of weeks, it makes sense to ride with what you have, trim selectively in names that have had big moves off of the lows, and add new risk only in those stocks/sectors that have lagged and money is just beginning to rotate into. In September we suggested Biotech when it was down and out. It has now had a >15% move off the lows in the past 6 weeks. A few weeks back we wrote about the Exploration and Production sector, which is up modestly ~2.5%.
Snake OIL? How Portfolio Managers View Exploration & Production Stocks…
The message that Lil Nas X communicates is timely:
I’m gonna ride ’til I can’t no more…
We laid out the 7 conditions that point to further runway on the “old town road” and to his point, you keep riding until you can’t no more (i.e. conditions point to deterioration that would warrant getting off our horse until the storm passes). The data continues to imply that it’s a bit too early to get off of our horse, and we’ll keep riding even if we hit a couple of short term bumps. I’m with Nas…


